| Good name | Good alternative | Avoid |
|---|---|---|
| max_temp_c | MaxTemp | Maximum Temp (°C) |
| precipitation_mm | Precipitation | precmm |
| mean_year_growth | MeanYearGrowth | Mean growth/year |
| sex | sex | M/F |
| weight | weight | w. |
| cell_type | CellType | Cell type |
| observation_01 | first_observation | 1st Obs. |
18 Data entry/collection and storage using spreadsheets
Spreadsheets are often used as a multi-purpose tool for data entry, storage, analysis, and visualisation. Most spreadsheet software available allows users to perform all of these tasks. However, spreadsheets are best suited to data entry and storage. Analysis and visualisation should be done separately either by using other data tools or at least in a separate copy of the data file in order to reduce the risk of contaminating or accidentally changing the raw data in the spreadsheet.
Spreadsheets, by design, make humans format data to be viewed by the human eye rather than to be readable by a machine (Murrell, 2013). Data structured as such require greater amount of effort, usually in computer code, to be able to extract the information needed for analysis. However, if the initial structure is such that it is easily readable by a machine, the effort leading to analysis is much more simplified.
In this chapter, we discuss best practices in using spreadsheets as a data entry and data storage tool and provide specific recommendations for organising spreadsheet data in a way that both humans and computers can read. Following these recommendations allows the creation of spreadsheets that minimise errors, are easy for computers to process, and facilitate collaboration and public access. These well-structured spreadsheets integrate with reproducible methods, serving as a reliable foundation for robust analytic workflows.
18.1 Be consistent
Consistency is key in data organisation. Strive for uniformity in your data entry and organisation practices. By maintaining this consistency from the start, you can save yourself and your collaborators from the hassle of reconciling inconsistencies later on.
Following are some examples of being consistent and why it is important. Some of these examples are also part of the recommendations listed here.
- Use consistent codes for categorical variables.
For a categorical variable like the sex, use a single common value for males (e.g., “male”), and a single common value for females (e.g., “female”). Do not sometimes write “M,” sometimes “male,” and sometimes “Male.” Pick one and stick to it. In order to limit the occurrence of this inconsistency, you can enforce a data validation rule for this variable (see Section 18.11).
- Use a consistent fixed code for any missing values.
It is ideal to have every cell filled in so that distinguishing between truly missing values and unintentionally missing values is more straightforward. Decide right at the outset what value to use for missing values and stick with that value throughout. Do not use a note explaining why a value is missing in place of the data itself. Rather, make a separate column with such notes.
- Use consistent variable names.
Name variables exactly the same way throughout one file and across every other file relevant to the project. If naming is inconsistent for the same variable, those working with the data will have to work out that these are all really the same thing. See Section 18.2 for more discussion on best practices in naming things within a data file. See Section 17.2.3 for an in-depth discussion on best practices in naming files.
- Use consistent subject identifiers.
Create consistent and unique subject identifiers to avoid extra work in figuring out which subject/record if which.
- Use a consistent data layout in multiple files.
If your data are in multiple files and you use different layouts in different files, it will be extra work for the analyst to combine the files into one dataset for analysis. With a consistent structure, it will be easy to automate this process.
- Use consistent file names.
Have some system for naming files. Keeping a consistent file naming scheme will help ensure that your files remain well organised, and it will make it easier to batch process the files if you need to. See an in-depth discussion of file naming in Section 17.2.3.
- Use a consistent format for all dates.
Preferably use the standard format YYYY-MM-DD, for example, 2015-08-01. If sometimes you write 8/1/2015 and sometimes 8-1-15, it will be more difficult to use the dates in analyses or data visualisations. See Section 18.3 for more discussion on this.
- Use consistent phrases in your notes.
If you have a separate column of notes (e.g., "dead"), be consistent in what you write. Do not sometimes write "dead" and sometimes "Dead".
- Be careful about extra spaces within cells.
A blank cell is different than a cell that contains a single space. And "male" is different from " male " (i.e., with spaces at the beginning and end).
18.2 Choose good names for things
It is important to pick good names for things such as variables. This can be hard, and so it is worth putting some time and thought into it. Section 17.2.3 provides some general principles for naming files that can also be used when naming variables in data.
18.2.1 General rules for naming
- Do not use spaces, either in variable names or file names
Spaces make programming harder. An analyst will need to surround a name that contains spaces in double quotes in order to refer to it. Use underscores (_) or hyphens (-) instead of spaces. Do not use a mixture of underscores and hyphens; pick one and be consistent.
- No extraneous spaces at the start and/or end of variable names
Be careful about extraneous spaces at the beginning or end of a variable name. "sex" is different from "sex " (with an extra space at the end) or " sex" (with an extra space at the start).
- Avoid special characters, except for underscores and hyphens
Other symbols ($, @, %, #, &, *, (, ), !, /, etc.) often have special meaning in programming languages, and so they can be harder to handle. They are also a bit harder to type.
The main principle in choosing names, whether for variables or for file names, is short, but meaningful. So not too short. The following table (adapted from The Data Carpentry lesson on using spreadsheets) show good and bad example variables names.
The first column of variable names use the snake case naming convention which uses an underscore to replace a space and letters are in lower case. The second column of good alternative variable names use the camel case naming convention in which phrases are written without spaces or punctuation and with capitalised words.
18.3 Write dates as YYYY-MM-DD
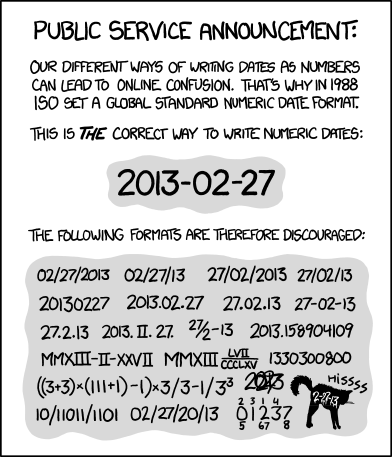
When entering dates, we strongly recommend using the global ISO 8601 standard, YYYY-MM-DD, such as 2013-02-27.
Microsoft Excel’s treatment of dates can cause problems in data. It stores them internally as a number, with different conventions on Windows and Macs (see Note 18.1). So, you may need to manually check the integrity of your data when they come out of Excel.
Note 18.1: Date systems in Microsoft Excel
Excel supports two date systems, the 1900 date system and the 1904 date system. Each date system uses a unique starting date from which all other workbook dates are calculated. All newer versions of Excel calculate dates based on the 1900 date system, while older versions used the 1904 system.
When you copy dates from a workbook created in an earlier version to a workbook created in a newer version, they will be converted automatically unless the option to "Automatically convert date system" is disabled in Preferences > Edit > Date Options. If this option is disabled, you will receive a message asking whether the dates should be converted when pasted. You have two options. You can convert the dates to use the 1900 date system (recommended). This option makes the dates compatible with other dates in the workbook. Or you can keep the 1904 date system for the pasted dates only.
The 1900 date system
In the 1900 date system, dates are calculated by using January 1, 1900, as a starting point. When you enter a date, it is converted into a serial number that represents the number of days elapsed since January 1, 1900. For example, if you enter July 5, 2011, Excel converts the date to the serial number 40729. This is the default date system in Excel for Windows, Excel 2016 for Mac, and Excel for Mac 2011. If you choose to convert the pasted data, Excel adjusts the underlying values, and the pasted dates match the dates that you copied.
The 1904 date system
In the 1904 date system, dates are calculated by using January 1, 1904, as a starting point. When you enter a date, it is converted into a serial number that represents the number of days elapsed since January 1, 1904. For example, if you enter July 5, 2011, Excel converts the date to the serial number 39267. This is the default date system in earlier versions of Excel for Mac. If you choose not to convert the data and keep the 1904 date system, the pasted dates vary from the dates that you copied.
The difference between the date systems
Because the two date systems use different starting days, the same date is represented by different serial numbers in each date system. For example, July 5, 2011, can have two different serial numbers, as follows:
| Date System | Serial Number |
|---|---|
| 1900 | 40729 |
| 1904 | 39267 |
The difference between the two date systems is 1,462 days. This means that the serial number of a date in the 1900 date system is always 1,462 days greater than the serial number of the same date in the 1904 date system. 1,462 days is equal to four years and one day (including one leap day).
*taken from Microsoft Support documentation
To avoid these issues with dates when using spreadsheets (specifically Excel), we recommend the following:
- Use a plain text format for columns in an Excel worksheet that are going to contain dates
Doing so will avoid automatic conversion of these variables into often unpredictable formats. This can be done through the following steps:
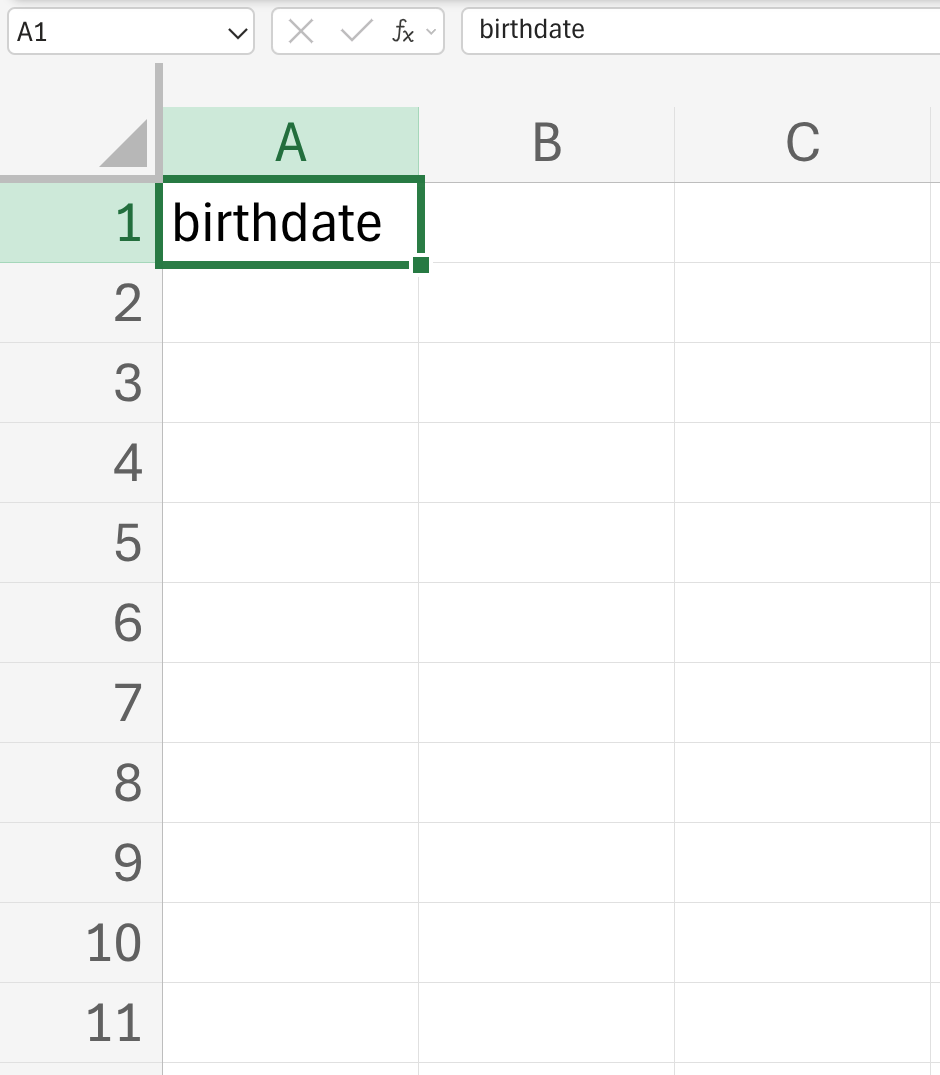
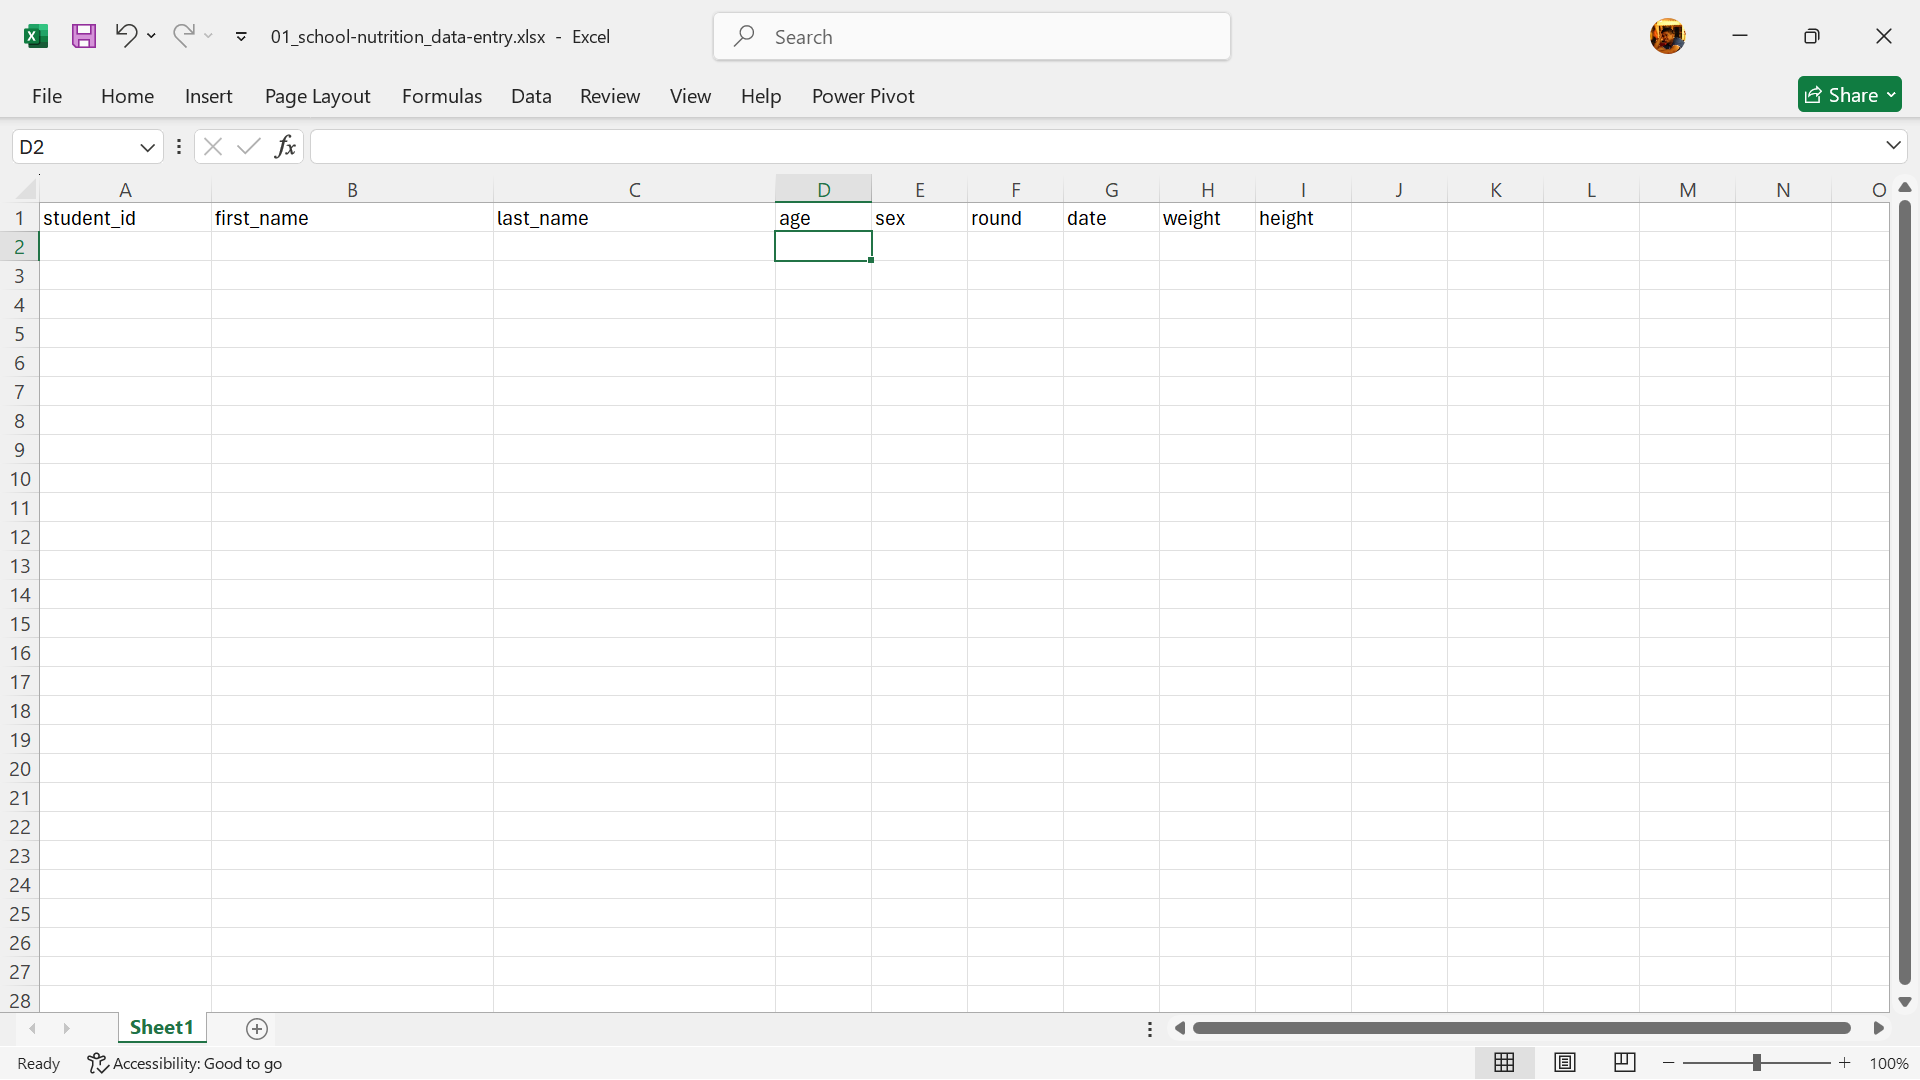
Step 1: Create a date variable (see Figure 18.2).
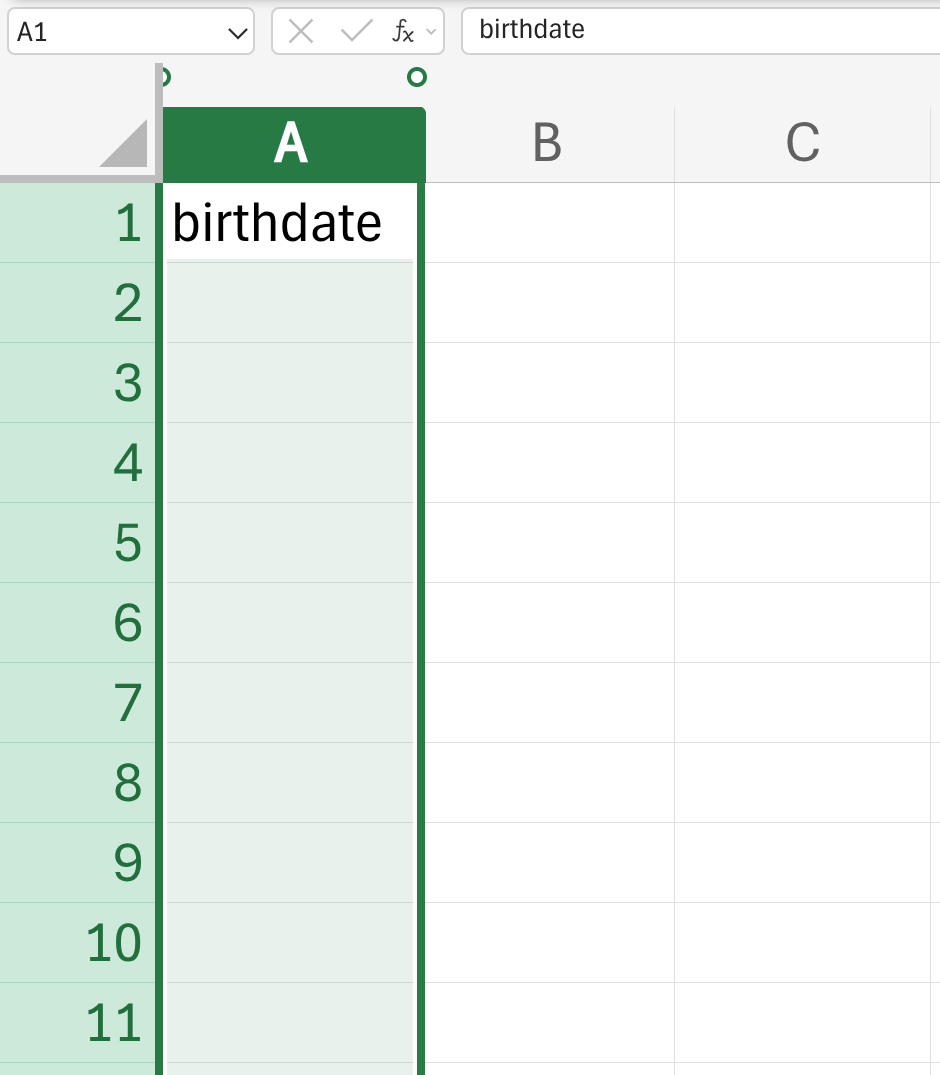
Step 2. Select the date variable you created (see Figure 18.3).
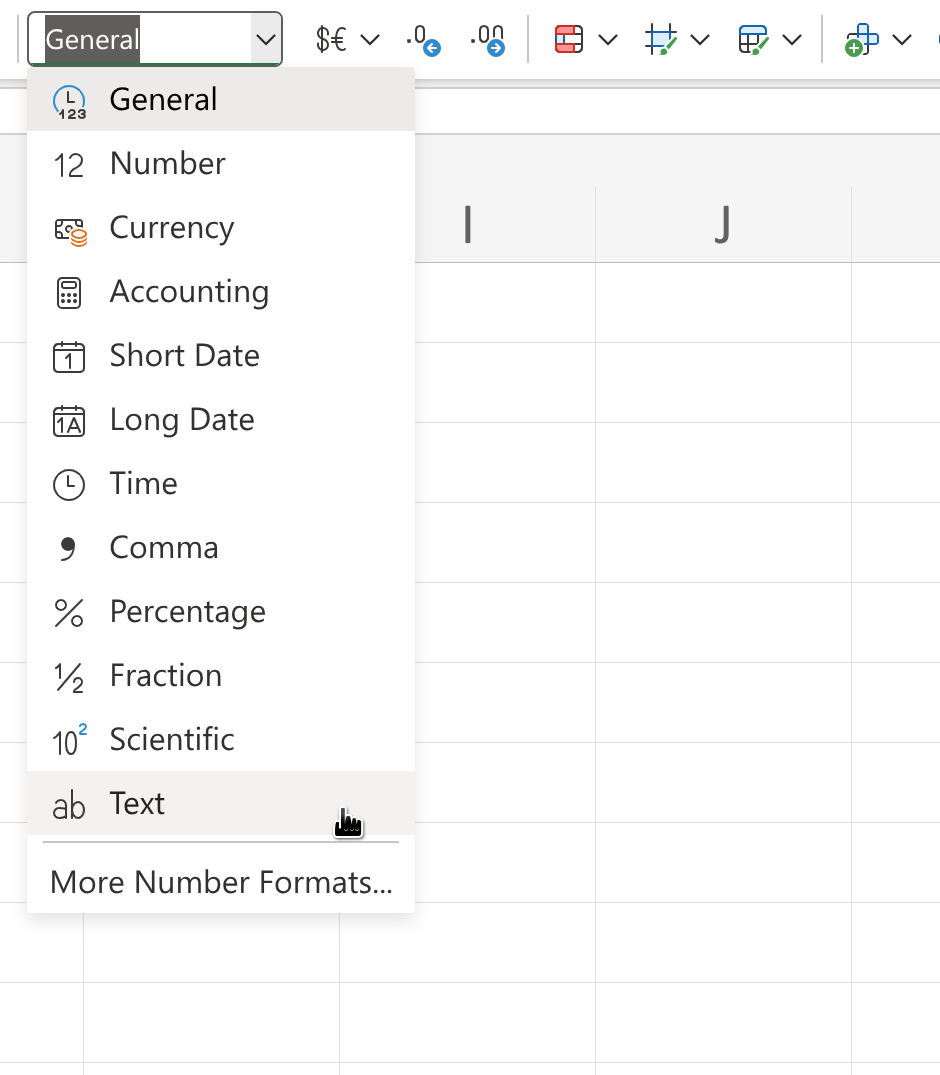
Step 3: In the menu bar, select Format –> Cells –> Choose “Text” on the left (see Figure 18.4).
This approach will only work if you are creating the date variable first and when no date values have been entered yet. If you do this on a date variable that already contain dates, Excel will convert them to a text value of their underlying numeric representation (as described in Note 18.1).
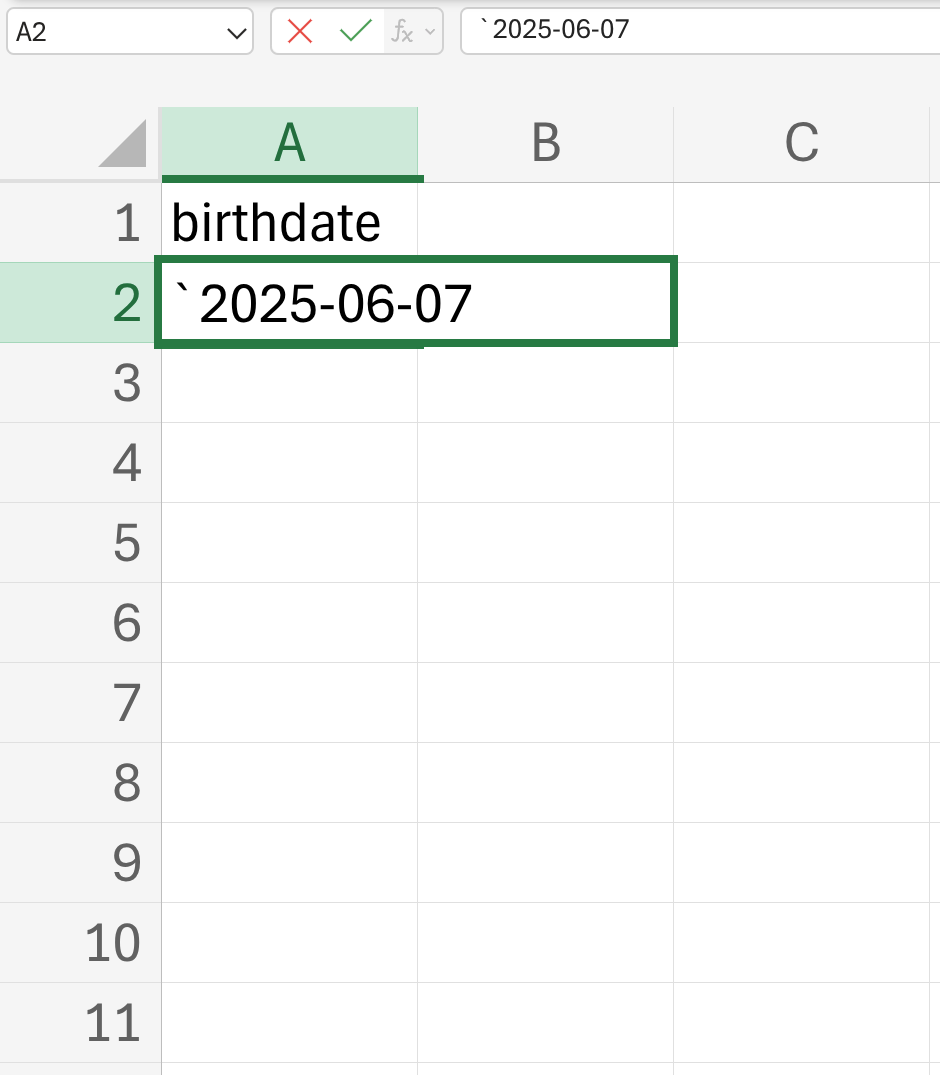
- Place an apostrophe at the start of a date value entry
Another way to force Excel to treat dates as text is to begin the date with an apostrophe, like this: '2014-06-14. Excel will treat the cells as text, but the apostrophe will not appear when you view the spreadsheet or export it to other formats. This is a handy trick, but it requires impeccable diligence and consistency.
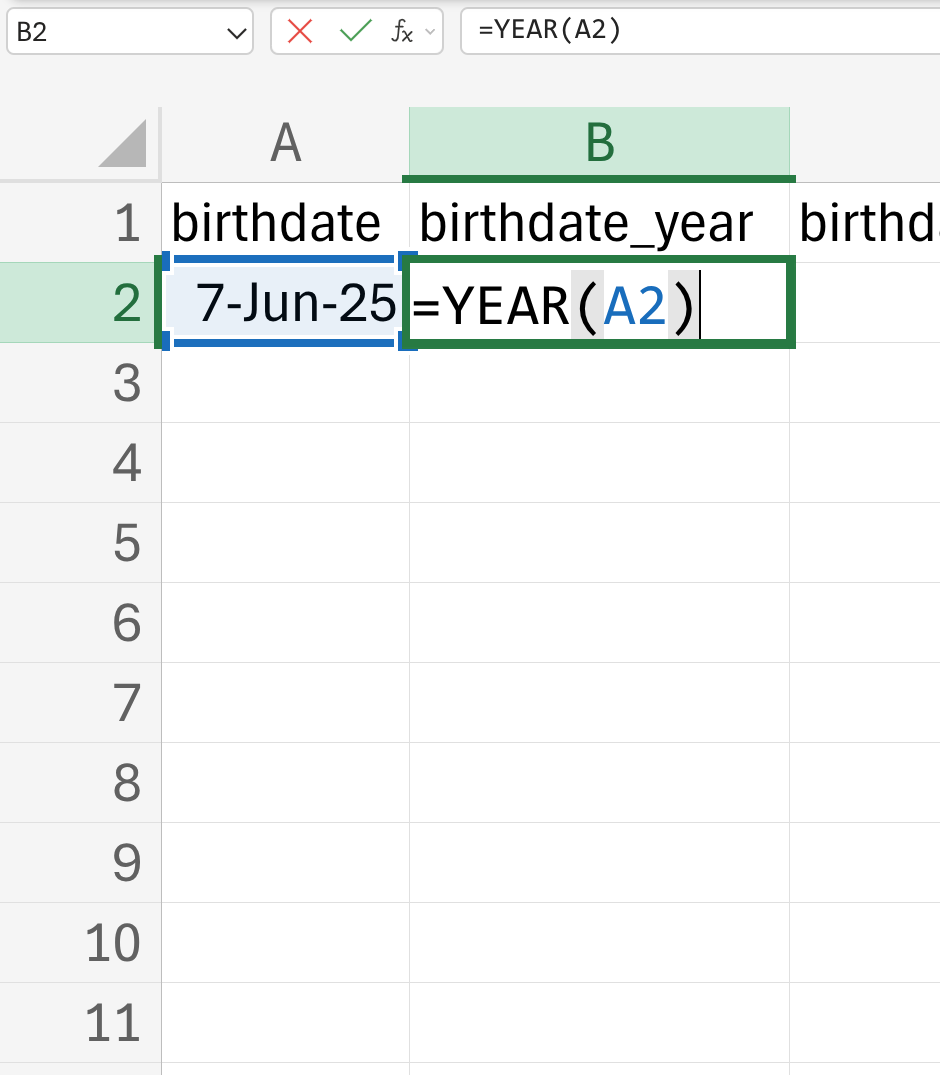
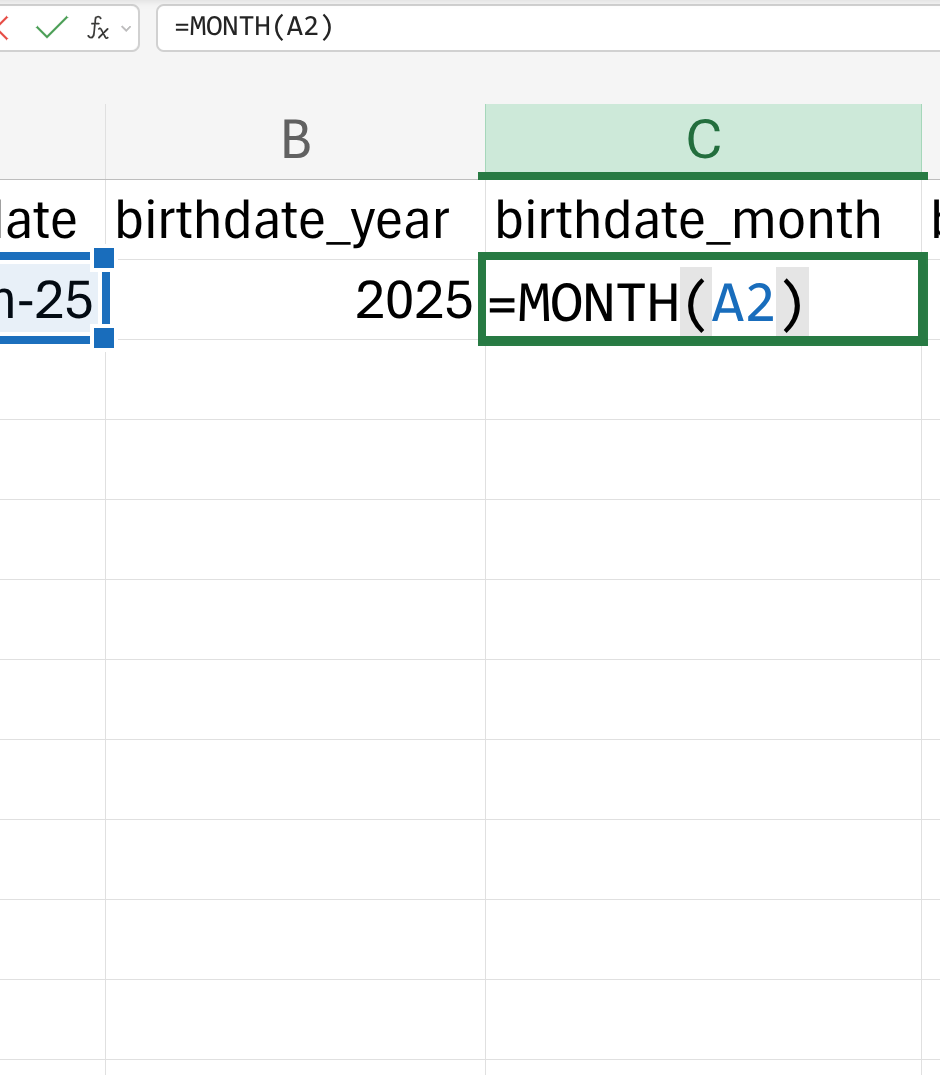
- Create three separate columns with year, month, and day
These will be ordinary numbers, and so Excel will not mess them up. If there is an existing date variable already, you can convert that to year, month, and day columns by using the built-in date functions in Excel that extract year (Figure 18.6), month (Figure 18.7), and day (Figure 18.8) values from a date variable.

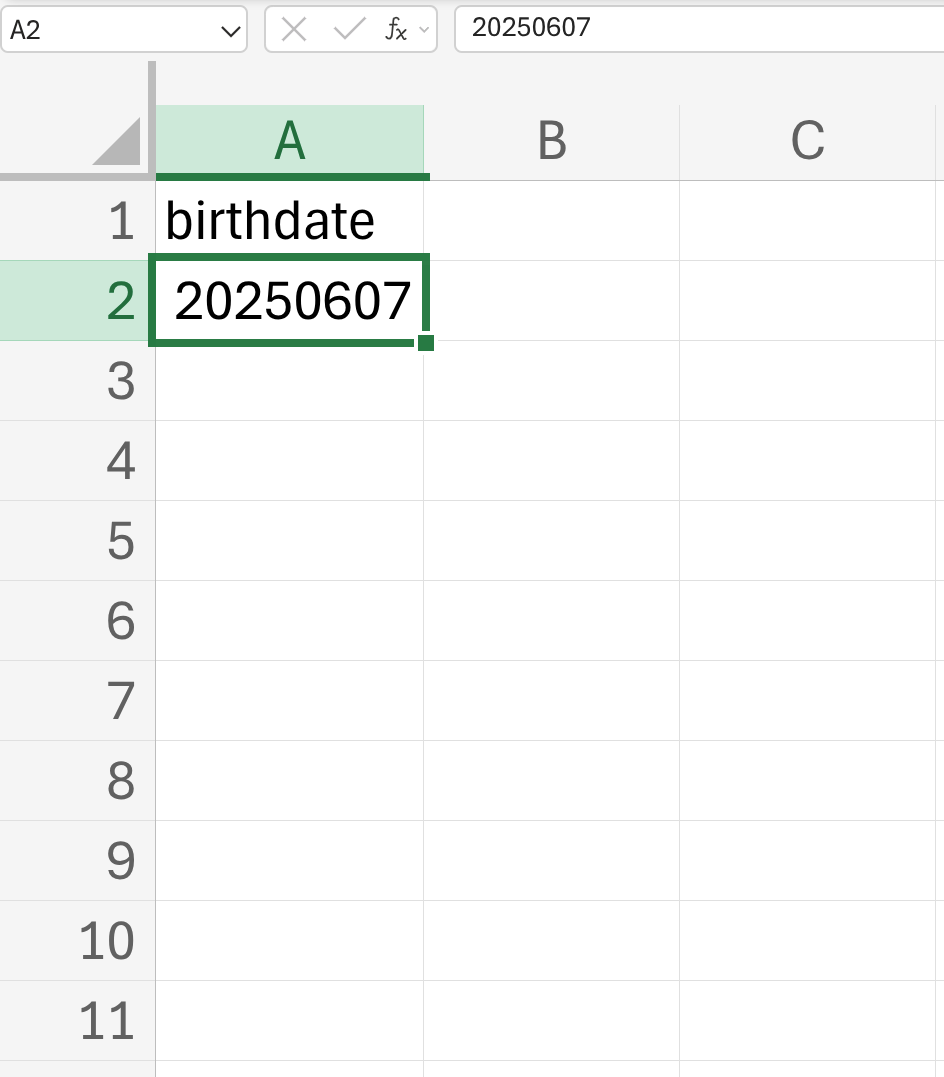
- Represent dates as an 8-digit integer of the form YYYYMMDD
For example, 20140614 for 2014-06-14 (see Figure 18.9).
18.4 No empty cells
Fill in all cells. Use some common code for missing data to make it clear that the data are known to be missing rather than unintentionally left blank.
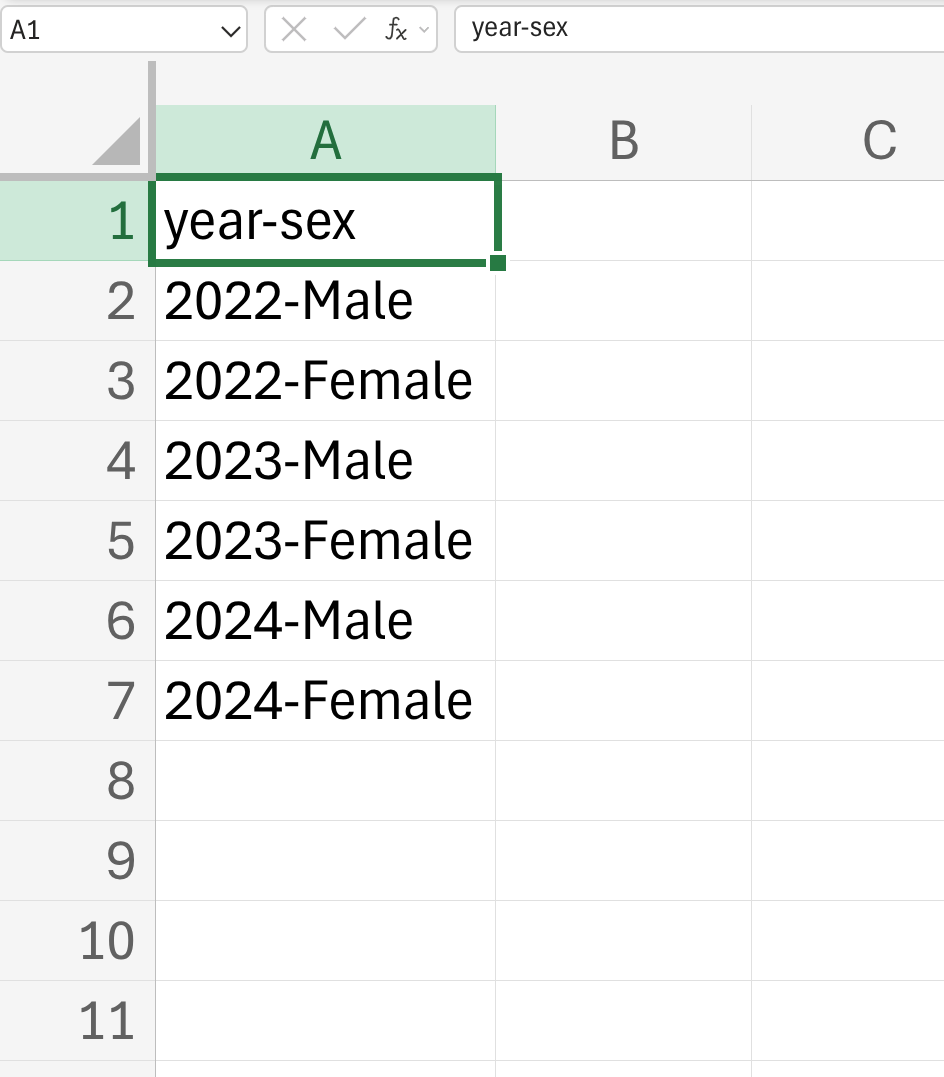
18.5 Put just one thing in a cell
Your spreadsheet should have cells that each contain one piece of data only. Putting more than one type of data value in a cell is not considered best practice.
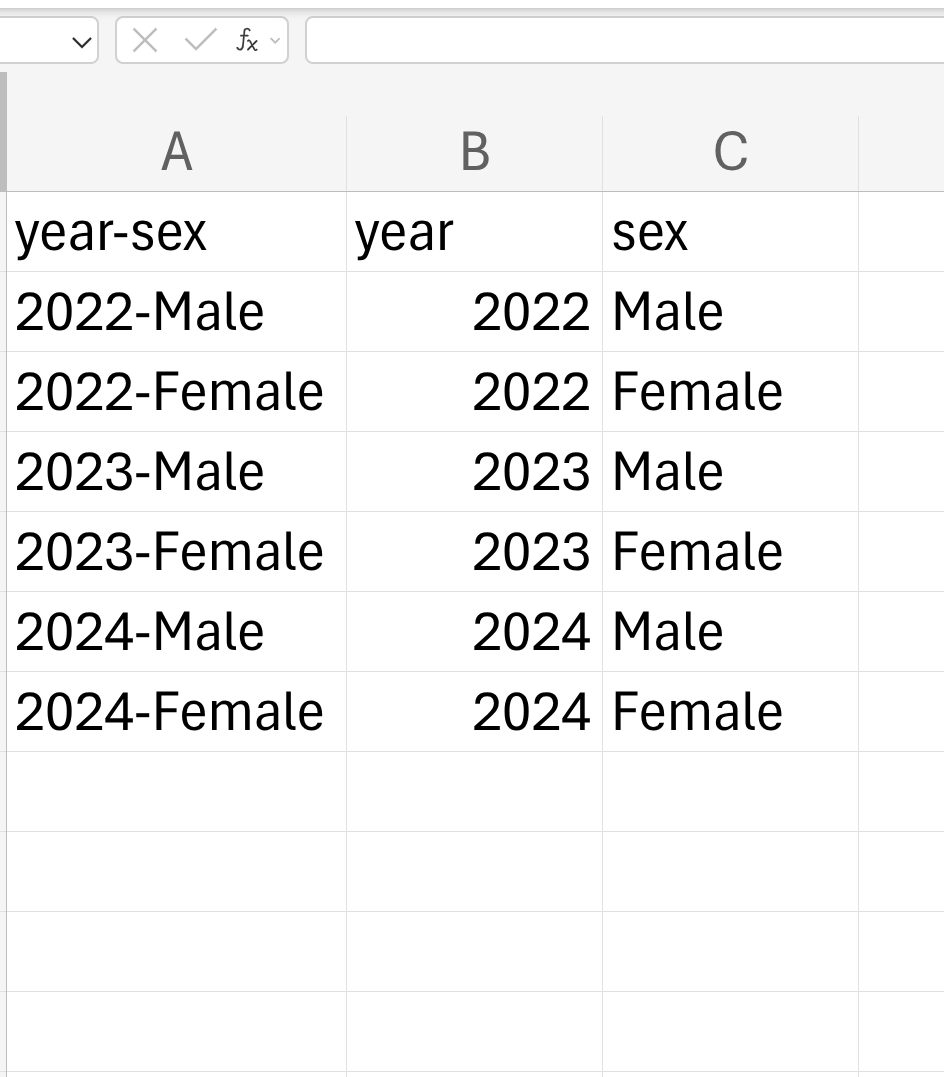
For example, you might have a column with information on year (containing values of either 2022, 2023, or 2024) and sex (Male or Female) as year-sex such as 2022-Male, 2022-Female, and so on and so forth. It would be better to separate this into year and sex columns (containing 2022 and Male).
Or you might include units alongside measurements such as weight. It is better to have a variable for the weight and then a separate variable for the units.
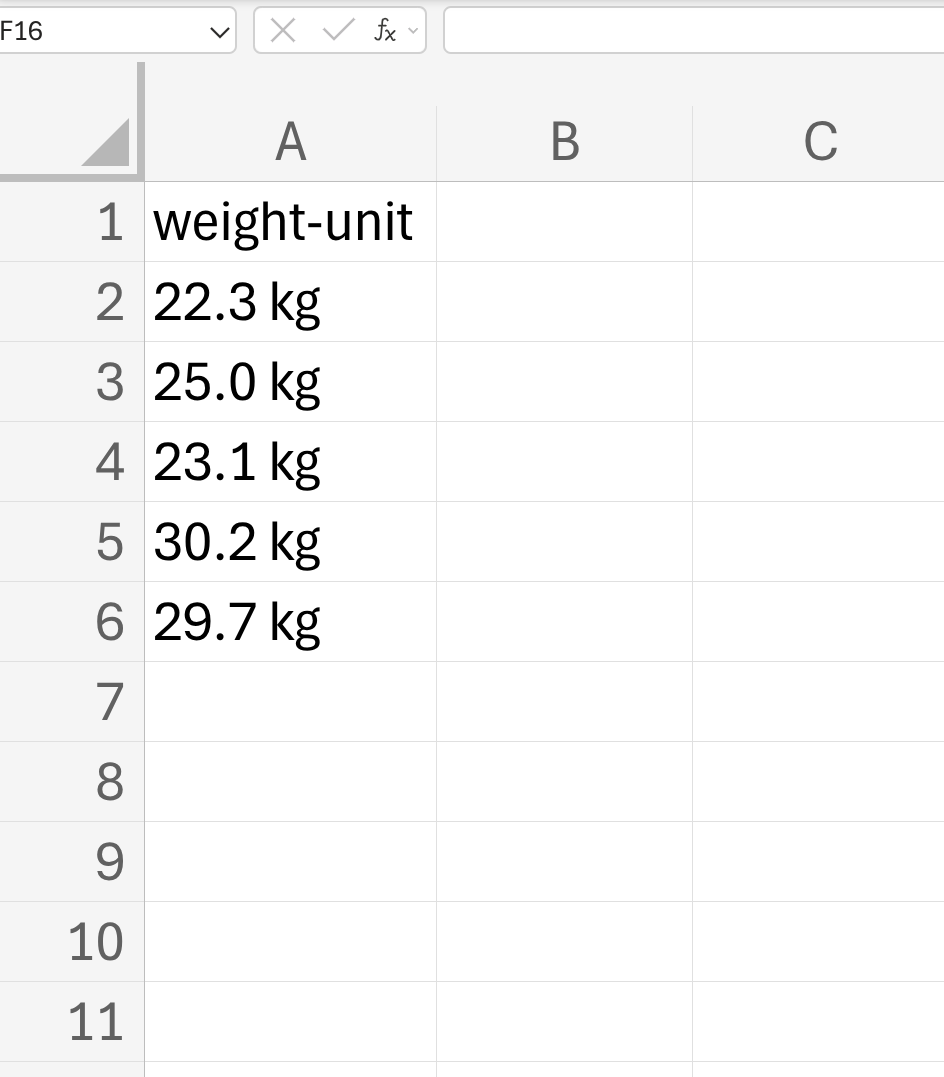
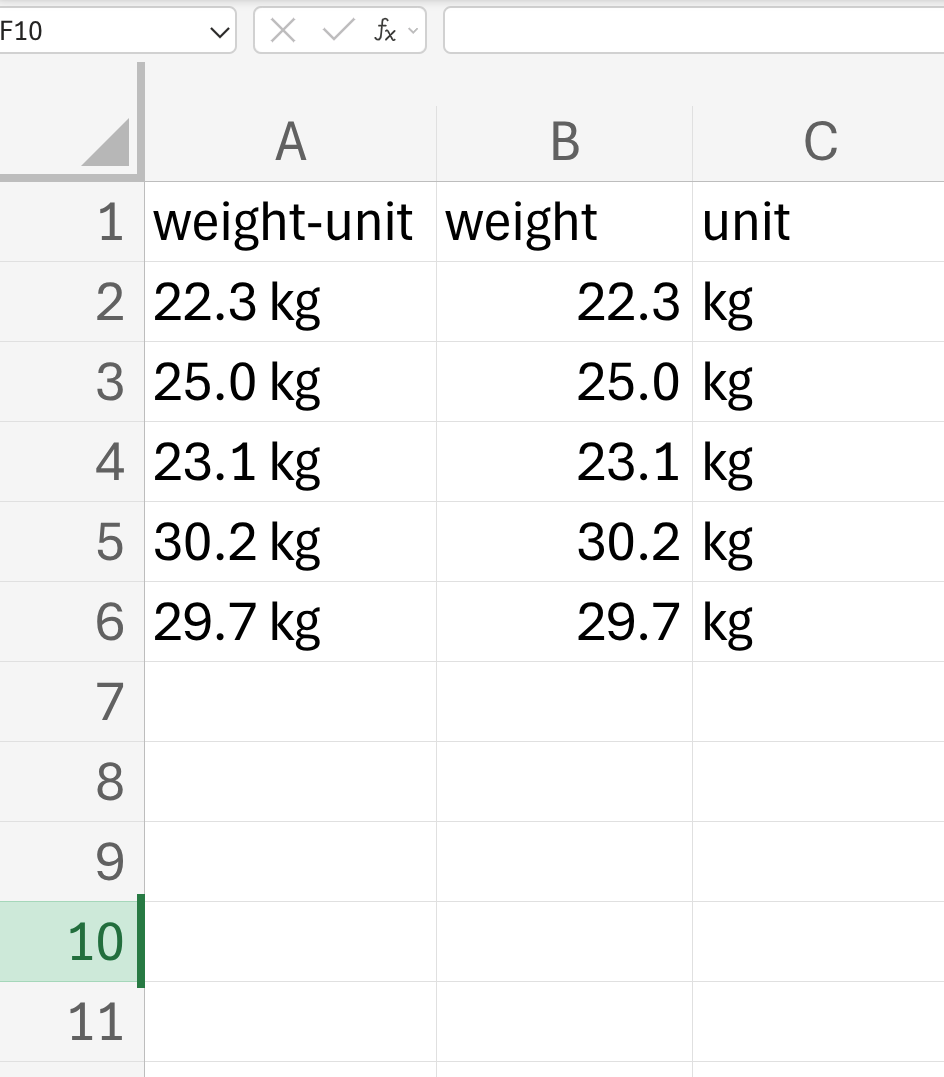
It is even better to just have a variable for weight and then document the units used in a separate data dictionary (see Section 18.7 on creating a data dictionary).
Finally, do not merge cells. It might look pretty, but you end up breaking the rule of no empty cells.
18.6 Make it a rectangle
A single big rectangle with rows corresponding to subjects and columns corresponding to variables is the best layout for data within a spreadsheet. The first row should always contain variable names. Do not use more than one row for the variable names.
18.7 Create a dictionary
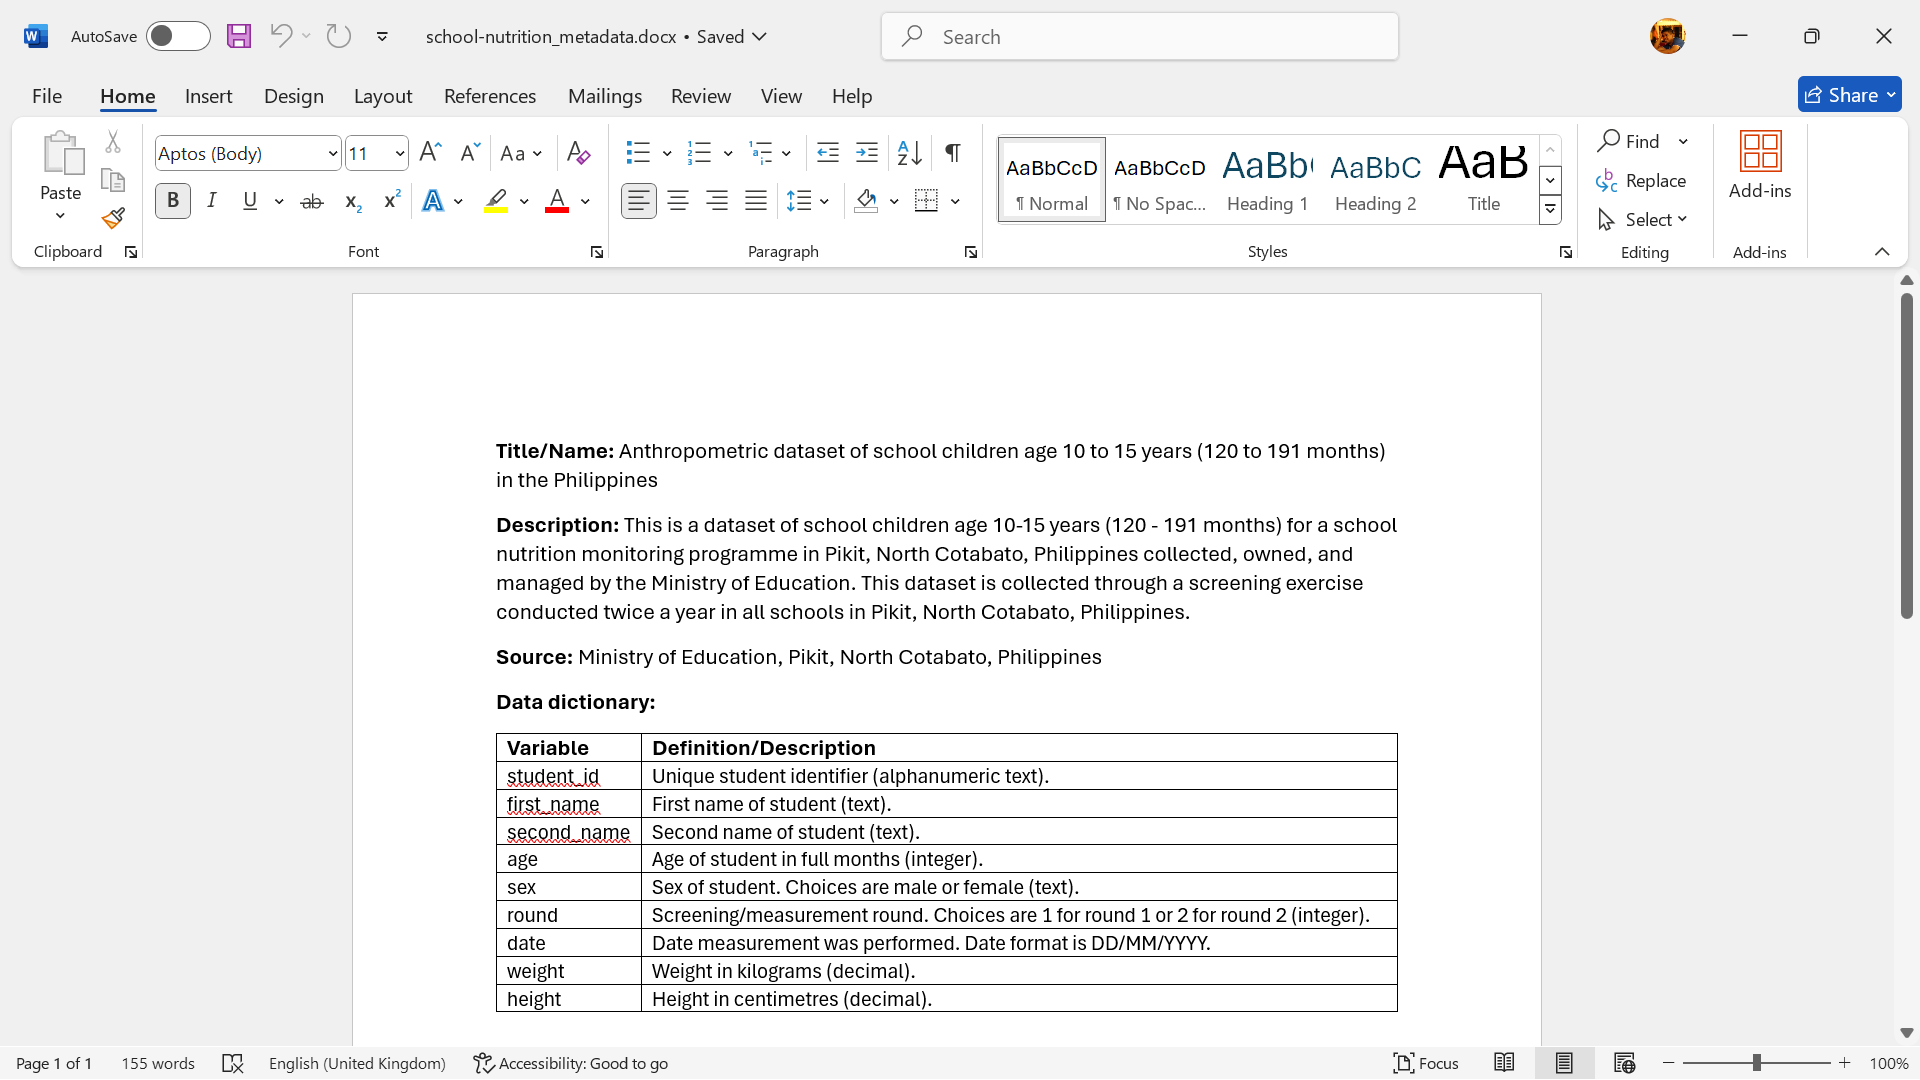
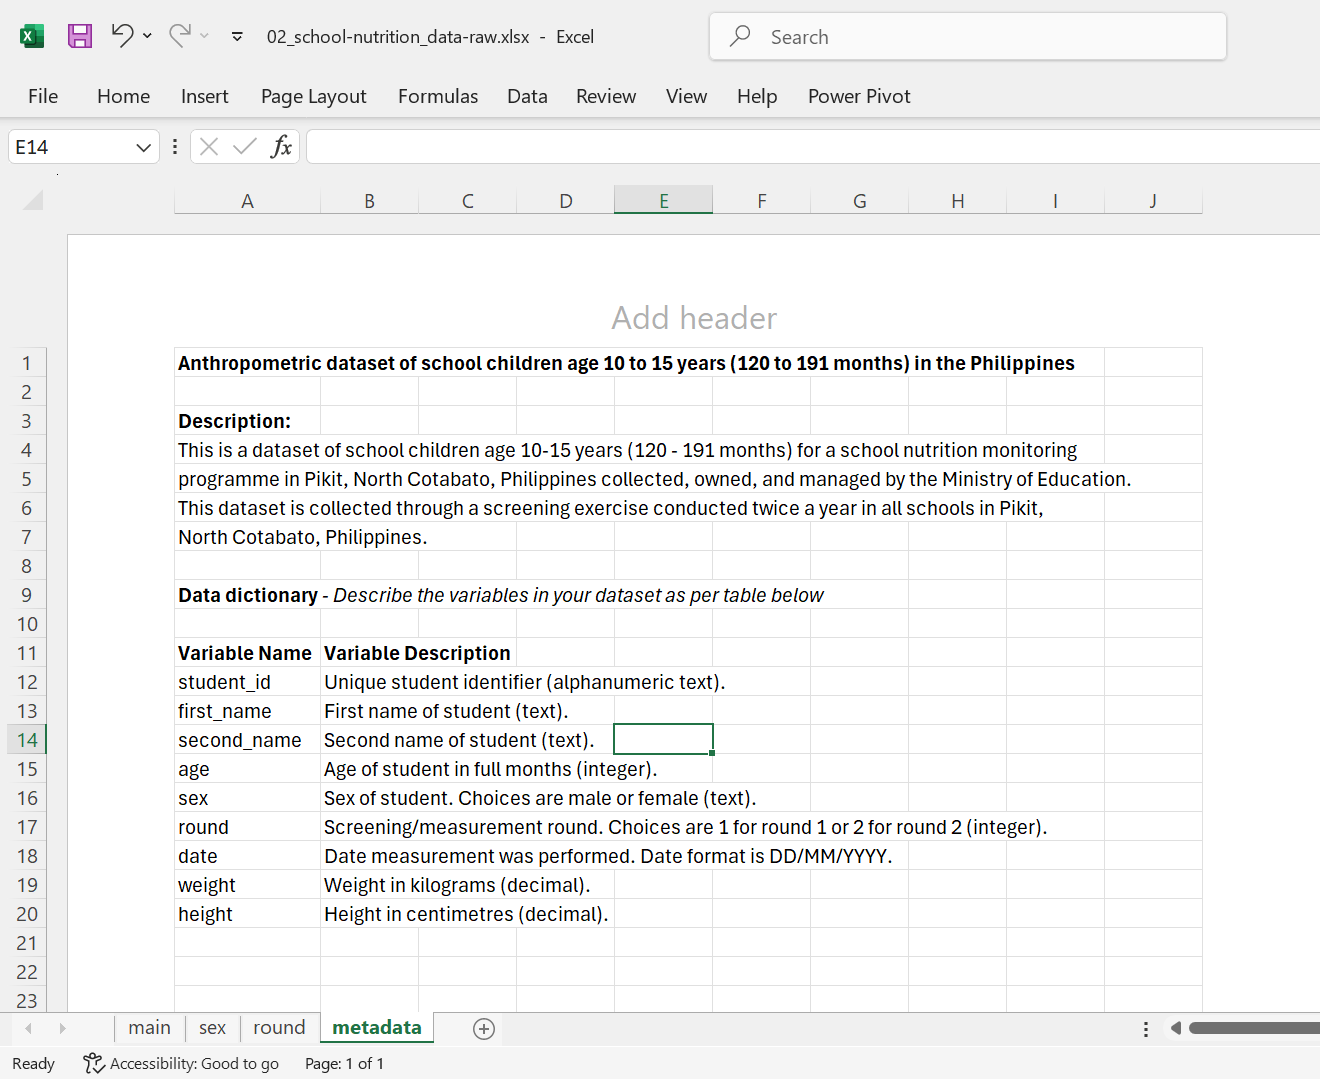
Having a separate file (see Figure 18.15) that outlines all variables can be very helpful, particularly if it’s organised in a structured layout so data analysts can use it effectively in their analyses. We recommend that this data dictionary includes the following information:
- The precise variable names as they appear in the dataset.
- A detailed description explaining what the variable represents.
- The measurement units associated with each variable.
- The list of possible values (for categorical variables) and/or typical range of values expected (for numerical variables) for that variable.
An example of this data dictionary within an accompanying Word document metadata in a project-based workflow is shown in Figure 18.16.

An alternative to a separate metadata and data dictionary file is to include this documentation as a separate worksheet within the spreadsheet containing the data.
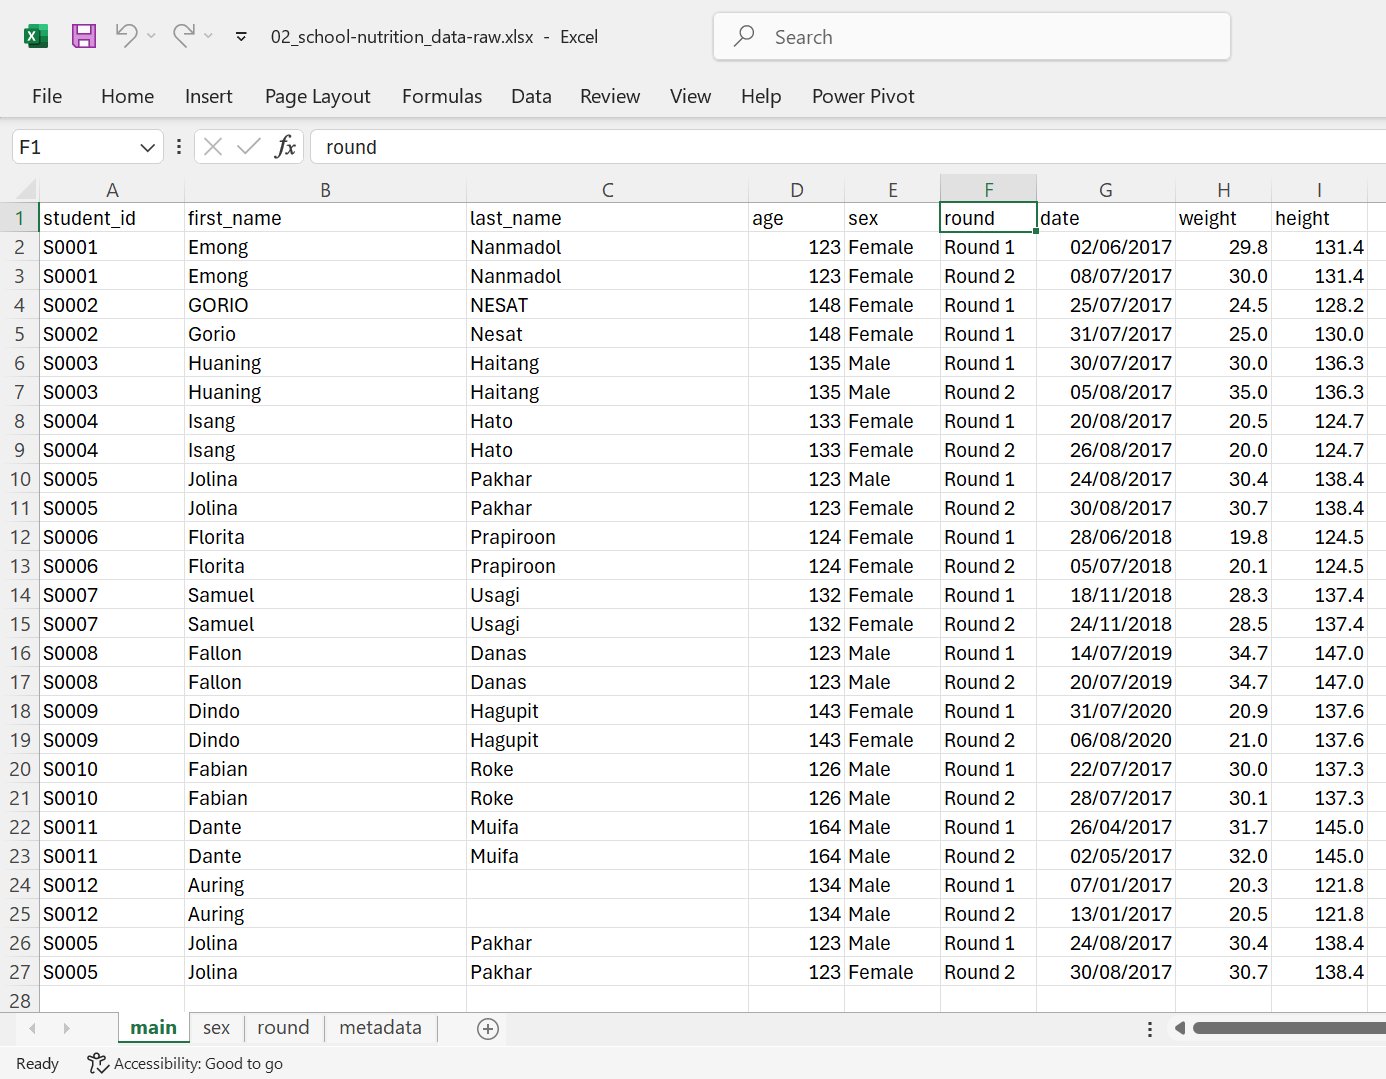
18.8 No calculations in the raw data file
Excel files often come with various calculations and graphs included alongside the data itself. We strongly recommend keeping your primary data file free from any additional content - only raw data should be present. This is because editing the same file for calculations can lead to accidental errors. For instance, when you open a file and start typing without selecting a cell, the text might end up in unexpected cells, causing problems during analysis. To prevent this, protect your main data file from changes, keep it backed up, and refrain from making edits. If you need to perform analyses or create graphs, work on a duplicate of the original file.
18.9 Do not use font colour or highlighting as data
You might be tempted to highlight particular cells with suspicious data, or rows that should be ignored. Or the font or font colour might have some meaning. Instead, add another column with an indicator variable (e.g., ”trusted” with values TRUE or FALSE).
Another possible use of highlighting would be to indicate males and females in a mouse study by highlighting the corresponding rows in different colours. But rather than use highlighting to indicate sex, it is better to include a sex column, with values Male or Female.
18.10 Make backups
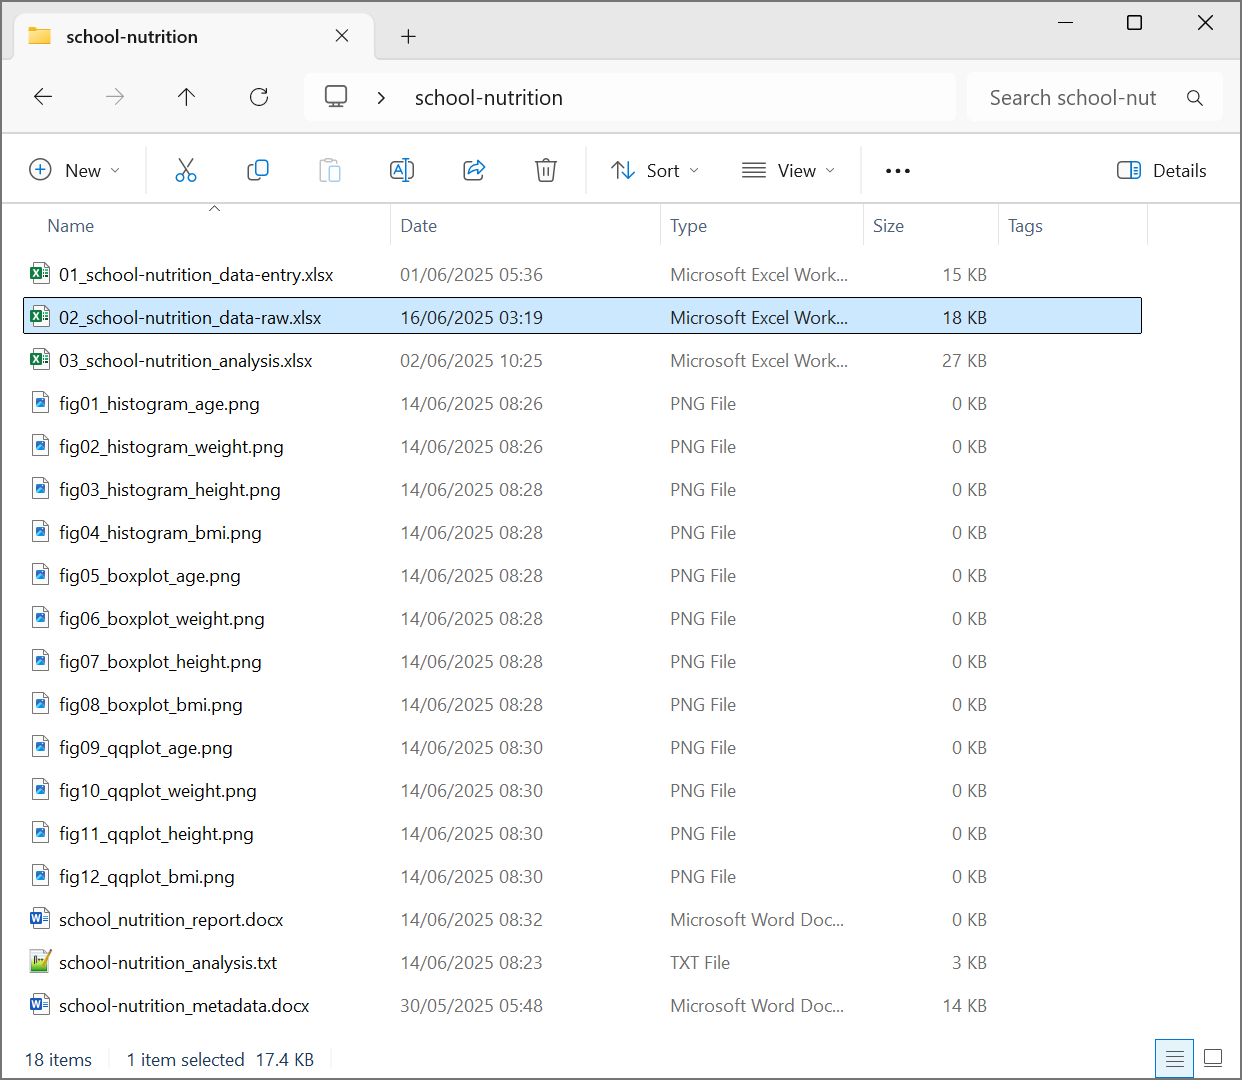
Regularly back up your data by storing copies in multiple locations. Consider using a formal version control system such as git (though it’s not ideal for data files). Keep every version of your data files and label them with version numbers, like file_v1.xlsx, file_v2.xlsx, and so on and so forth. For this, the guidance on good file names discussed in Section 17.2.3 is a good reference to follow for naming your file versions. Once you’ve finished entering data or if taking a break, protect the file from accidental changes by setting it to read-only as described below.
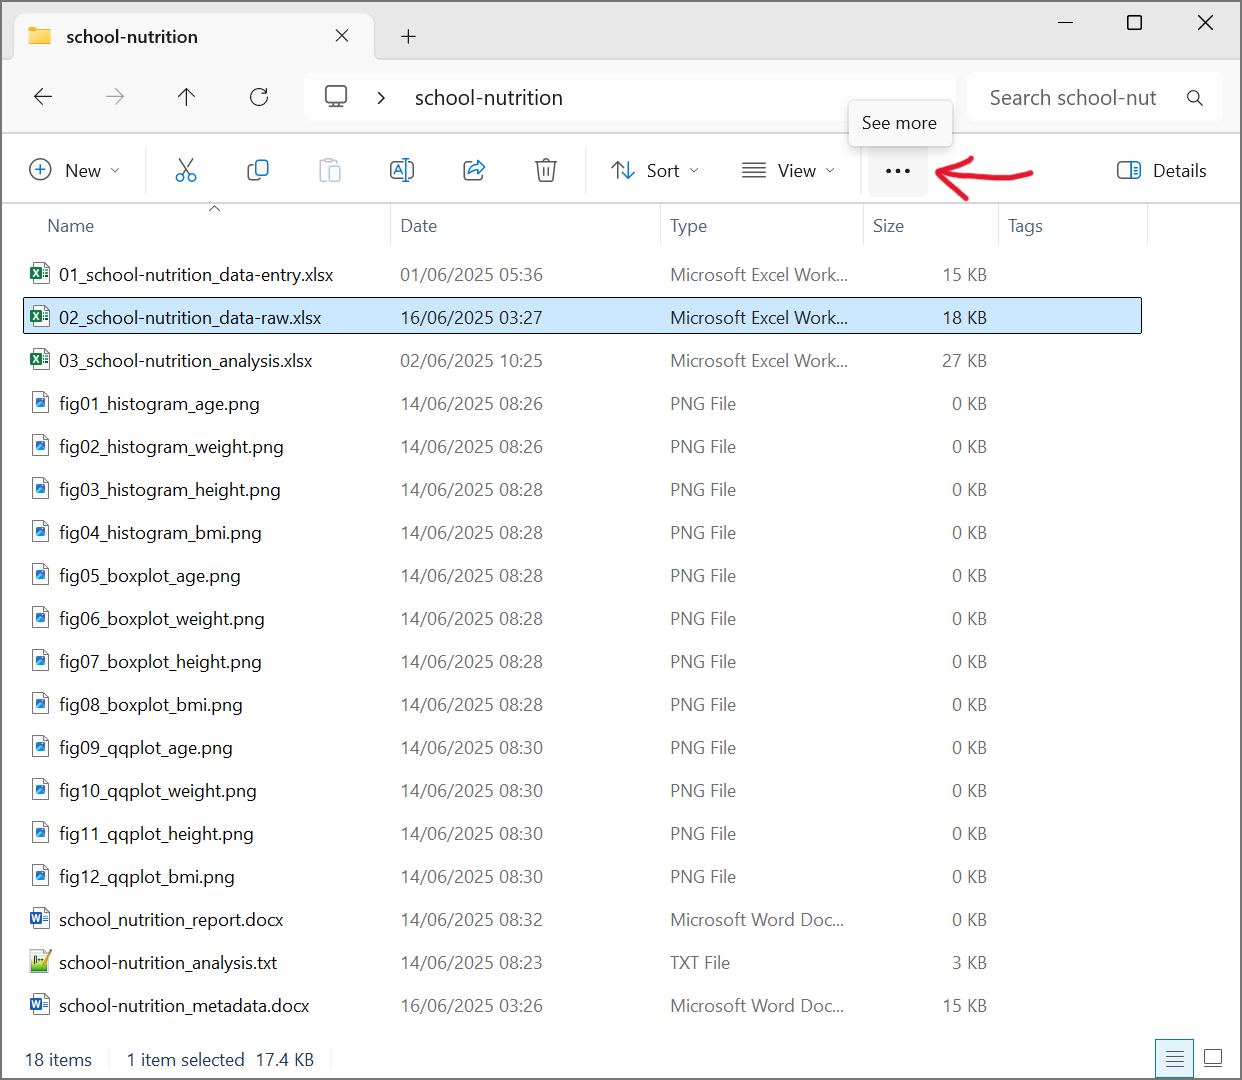
1, Right-click the file in File Explorer or select the file and then click on the triple dot icon in File Explorer as shown in Figure 18.20.
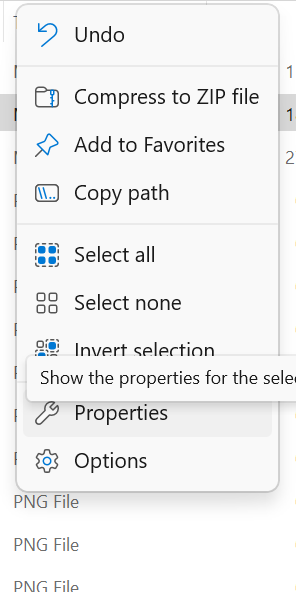
- In the drop-down menu, choose
Propertiesas shown in Figure 18.21.
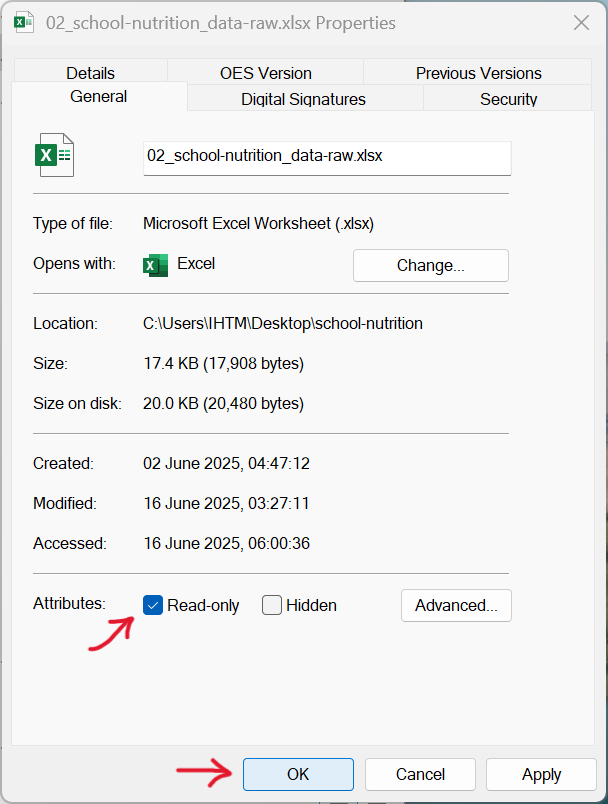
- In the pop-up menu, navigate to the
Generaltab, check theAttributesbox forRead-only, and confirm withOKas shown in Figure 18.22.
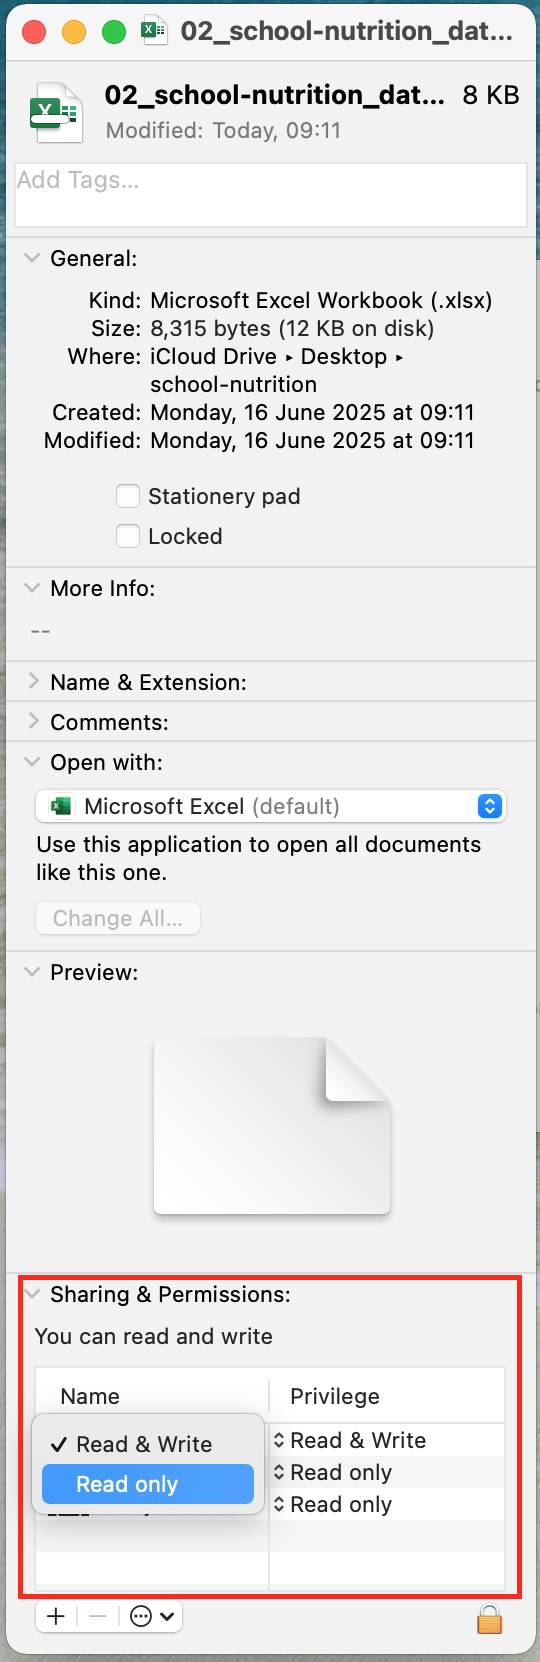
- Open Finder and right-click on the file.
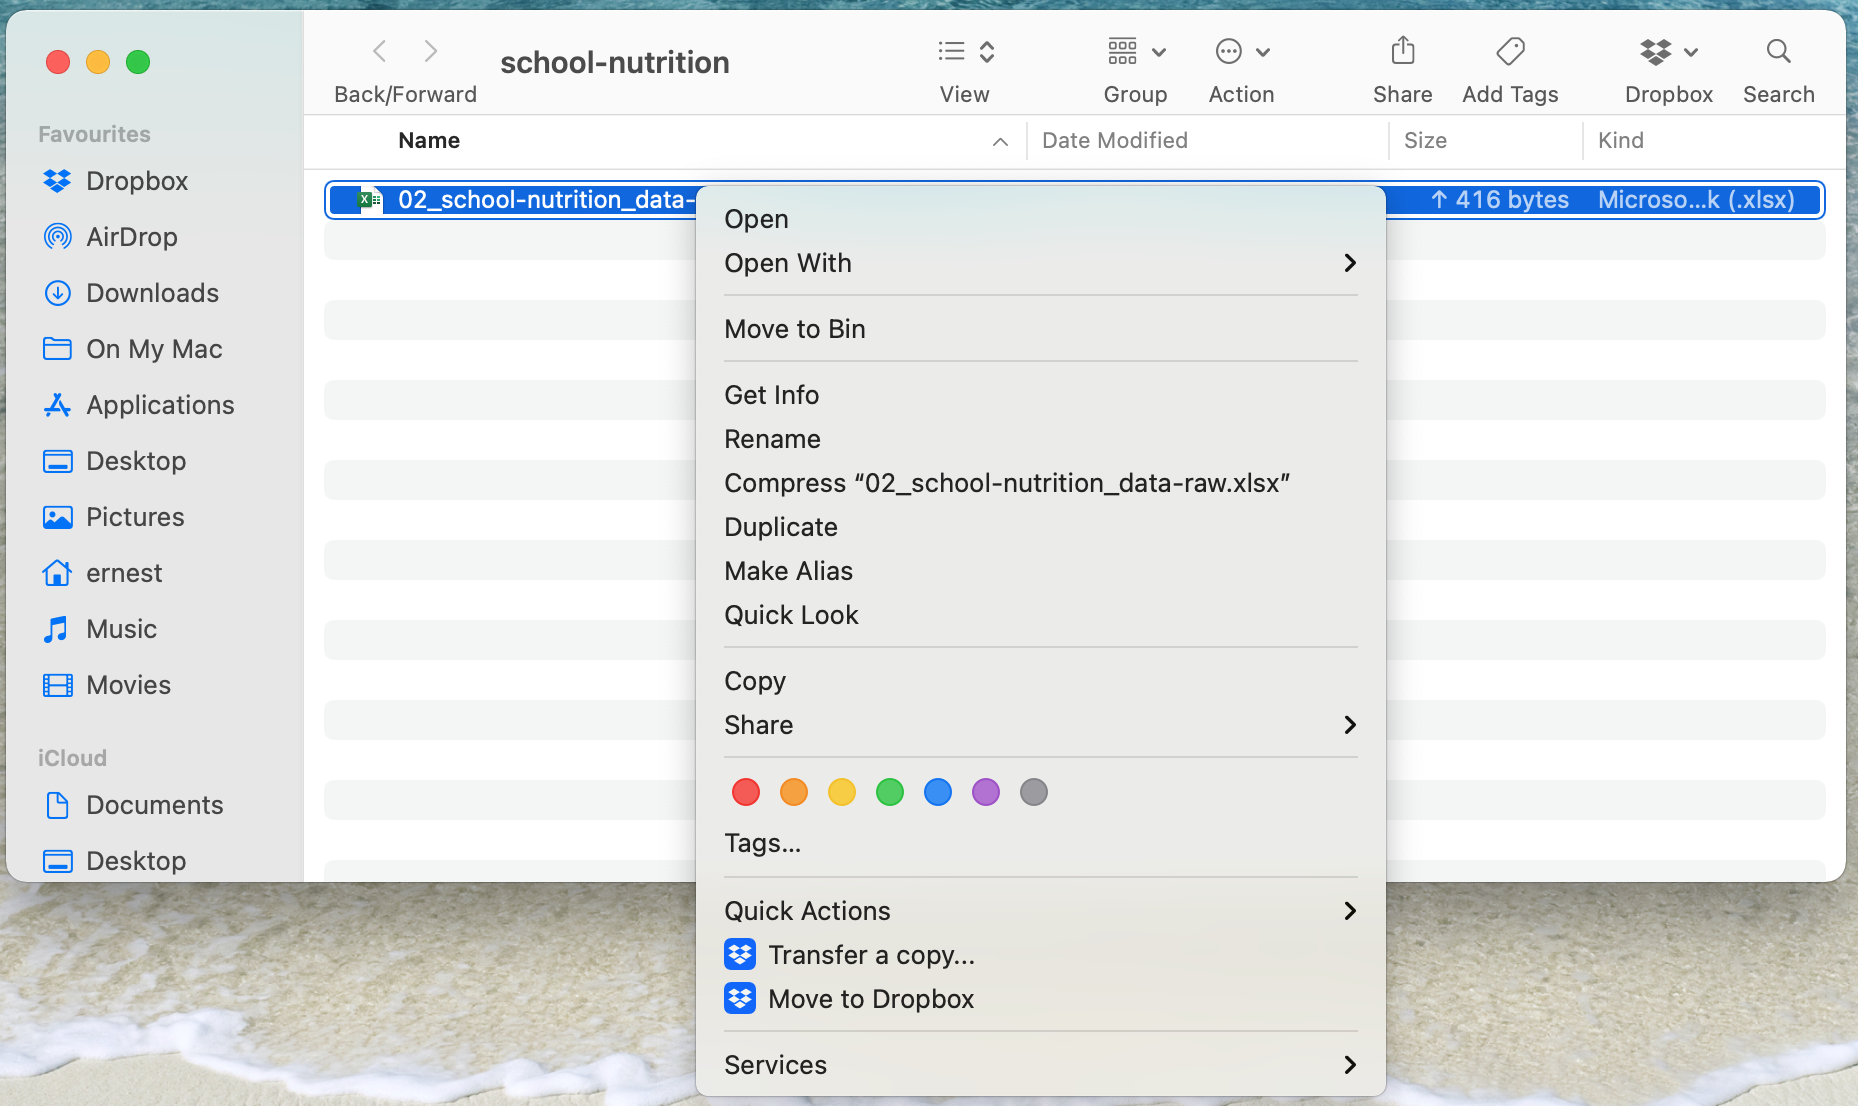
- Select
Get Infothen go toSharing & Permissions.
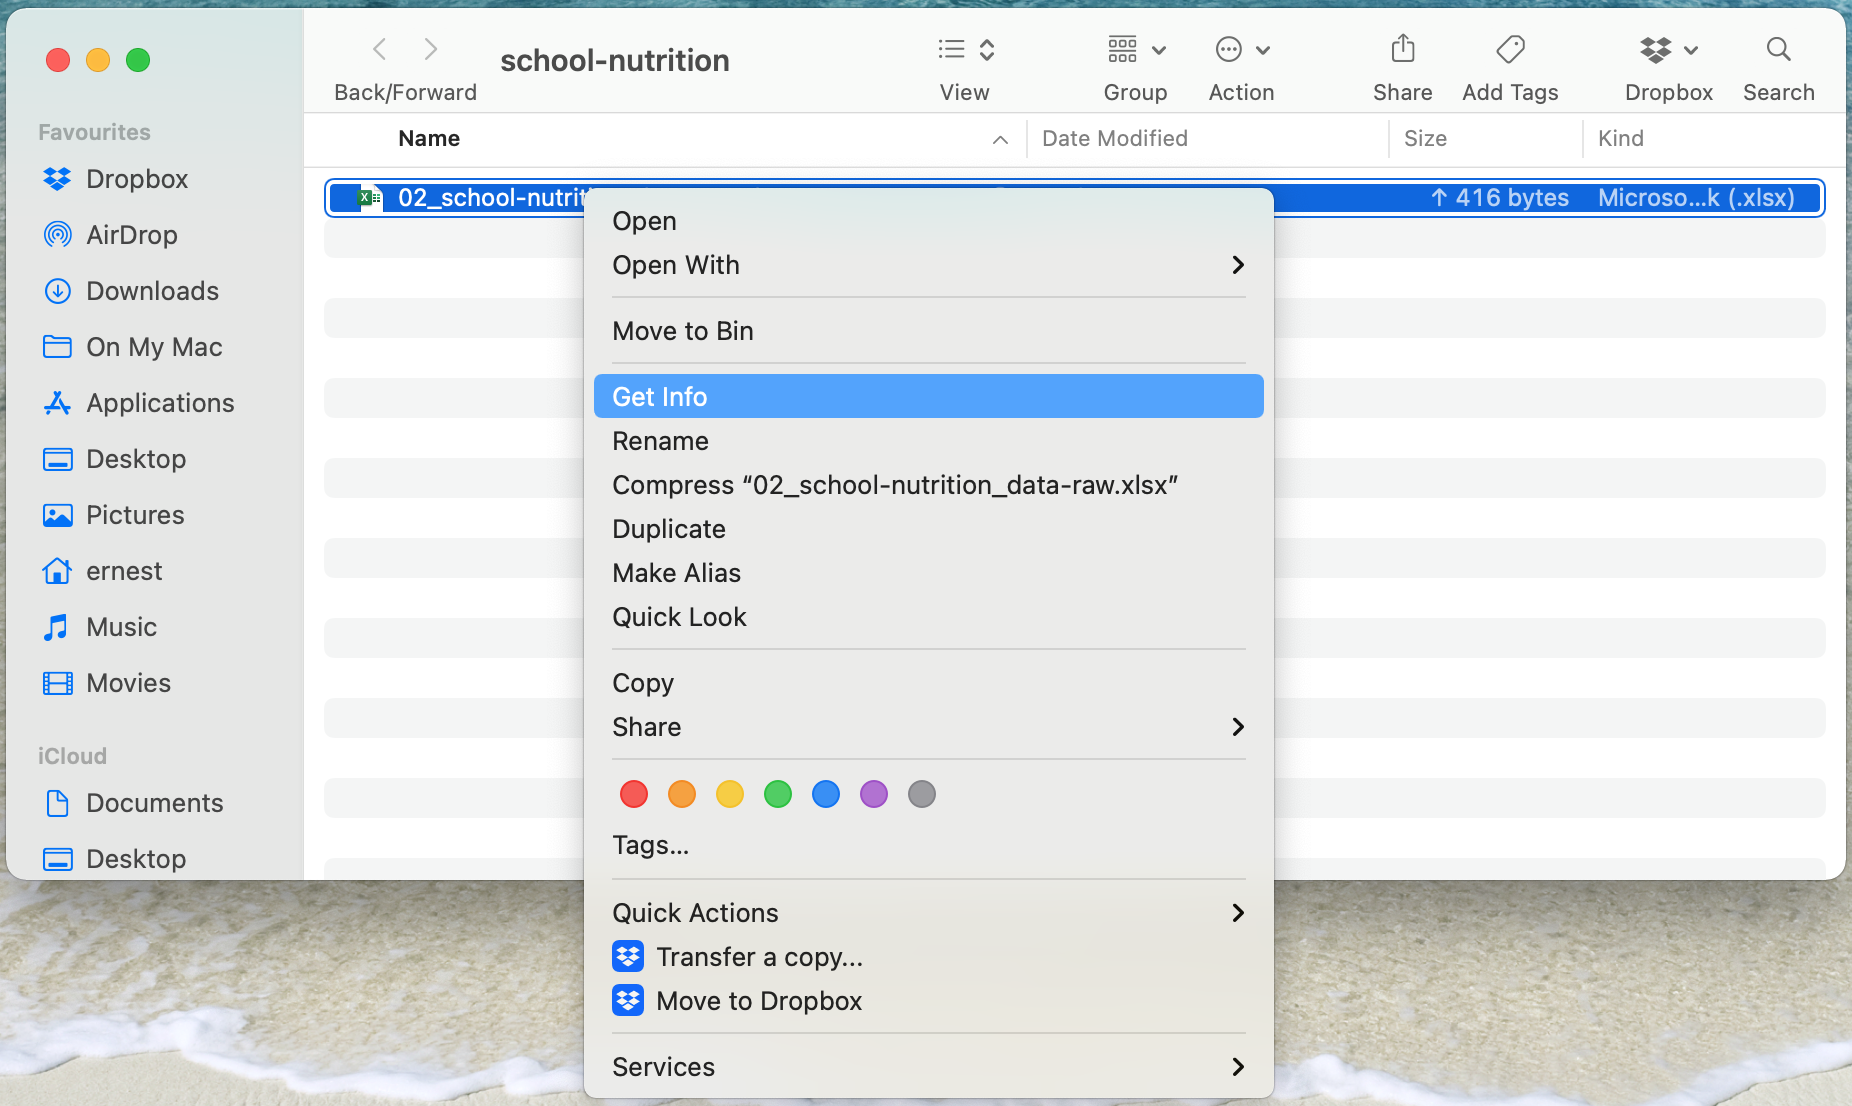
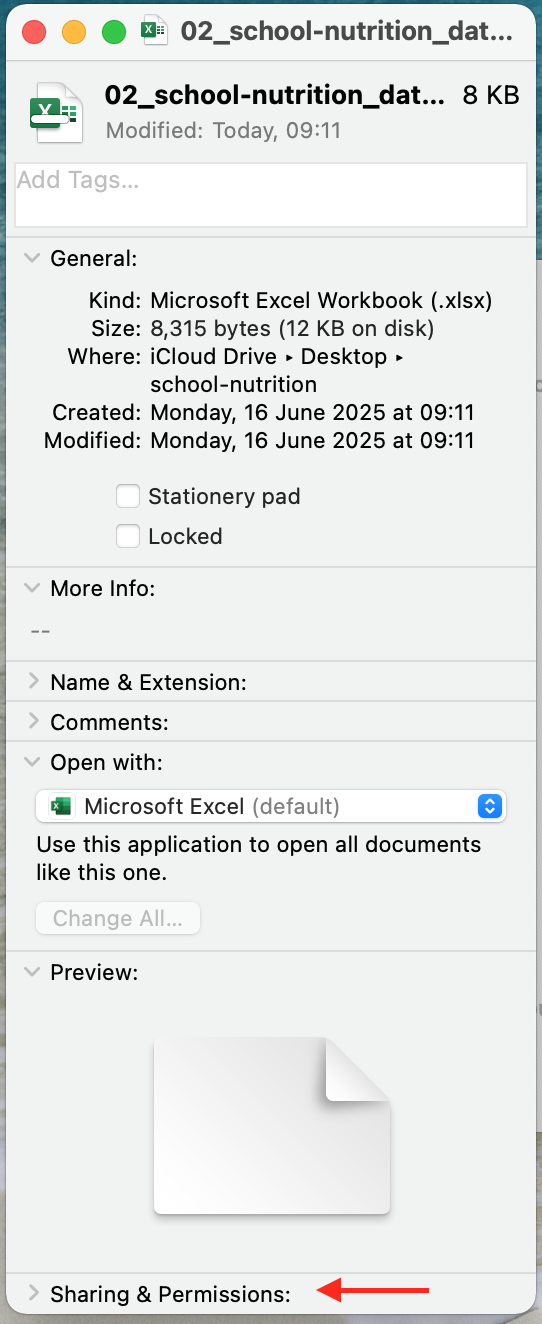
- Set your privileges to
Read only.
Another option is to password protect the worksheet in the spreadsheet that has the data.
- Select the worksheet to password-protect and then go to
Reviewas shown in Figure 18.31.
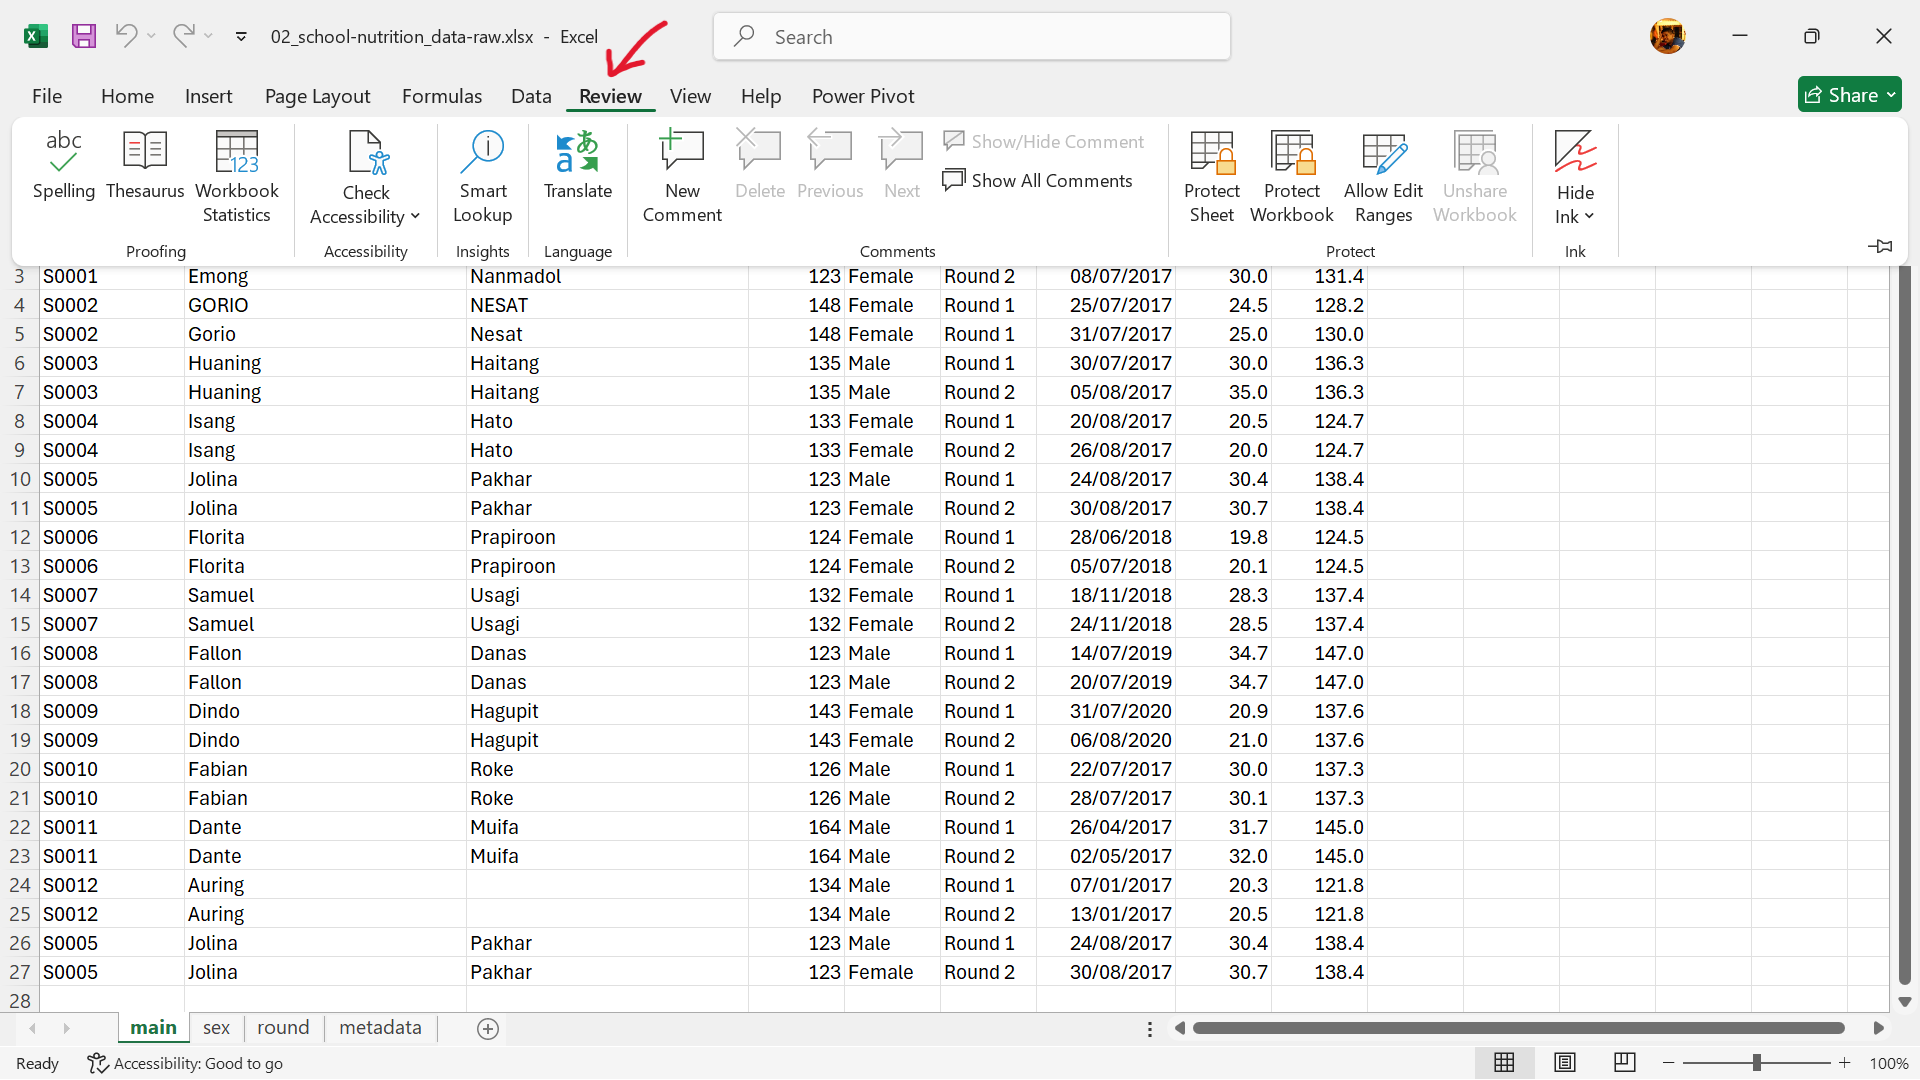
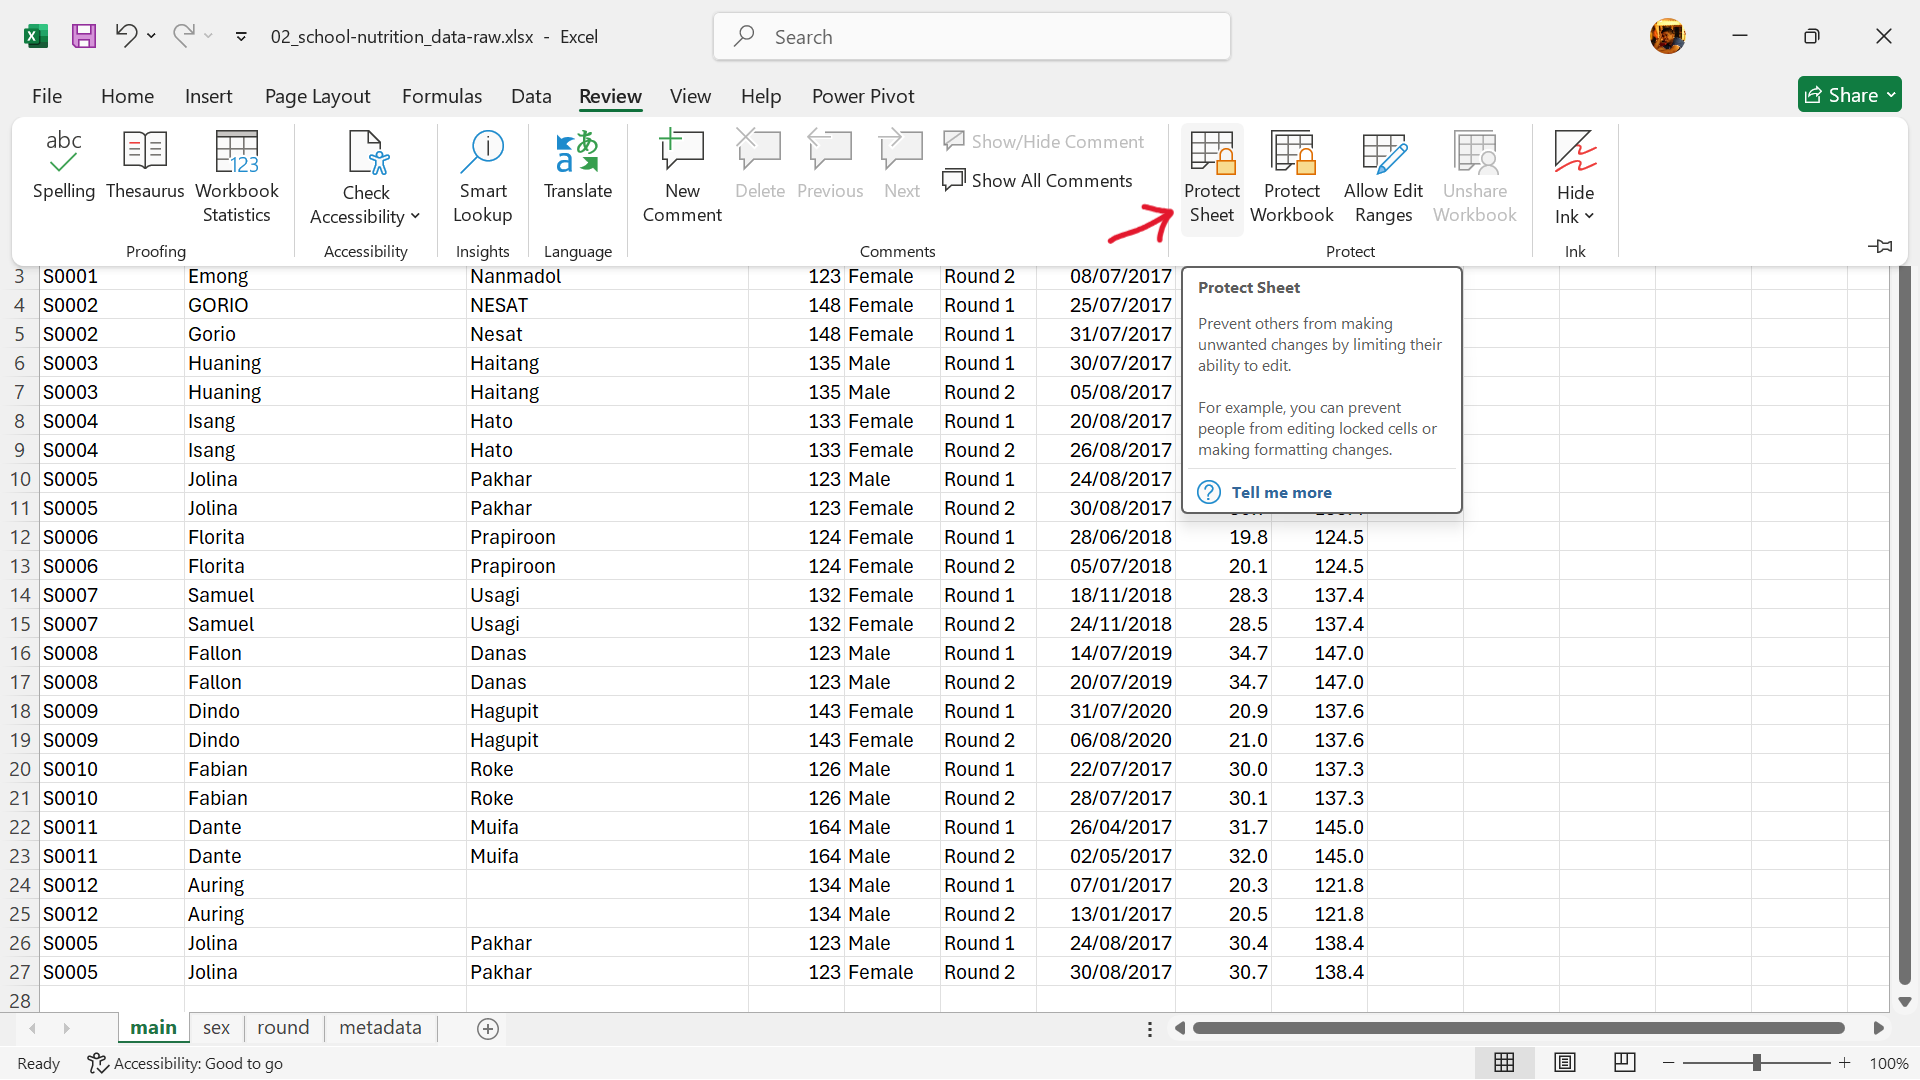
- Select
Protect Sheetas shown in Figure 18.28.
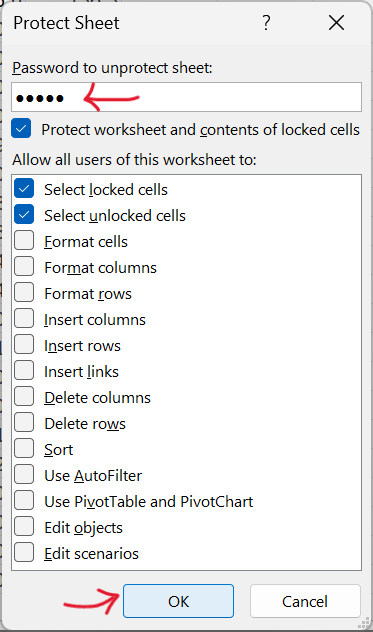
- Enter password to protect worksheet as shown in Figure 18.29.
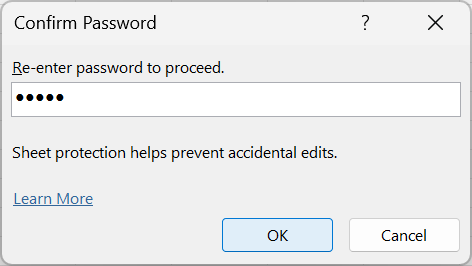
- Re-enter password to confirm protection as shown in Figure 18.30.
Password protection can also be applied to the whole spreadsheet workbook.
- Open the spreadsheet to password-protect and then go to
Reviewas shown in Figure 18.31.
- Select
Protect Workbookas shown in Figure 18.32.
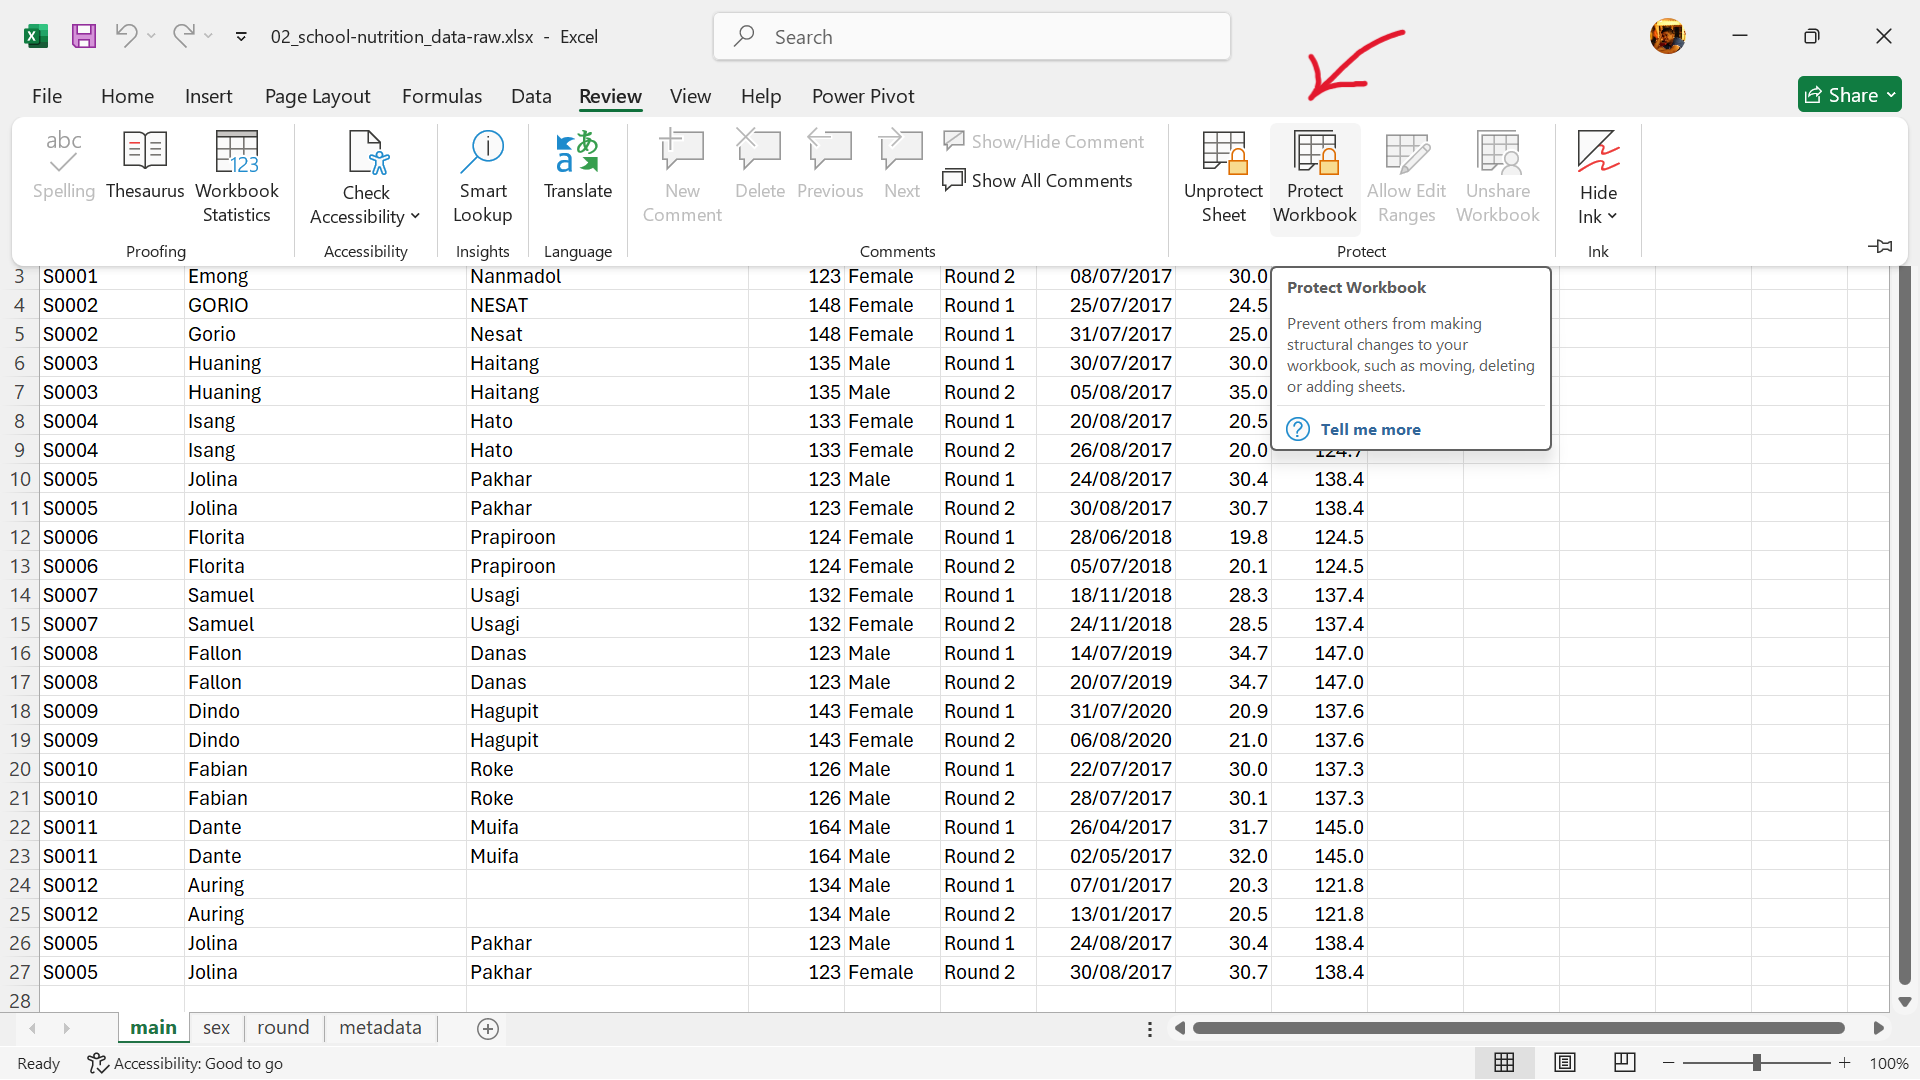
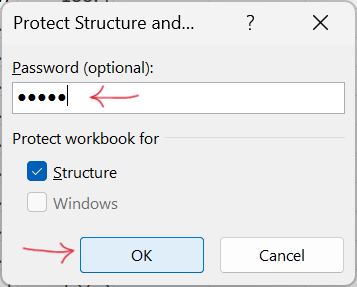
- Enter password to protect workbook as shown in Figure 18.33.
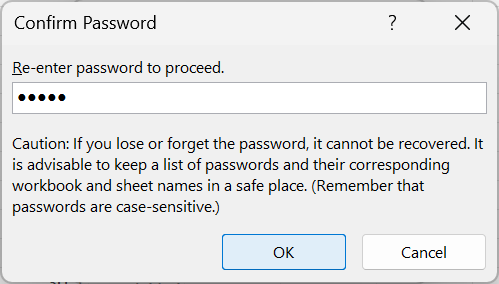
- Re-enter password to confirm workbook protection as shown in Figure 18.34.
Important 18.1
Remember, always back up your data!
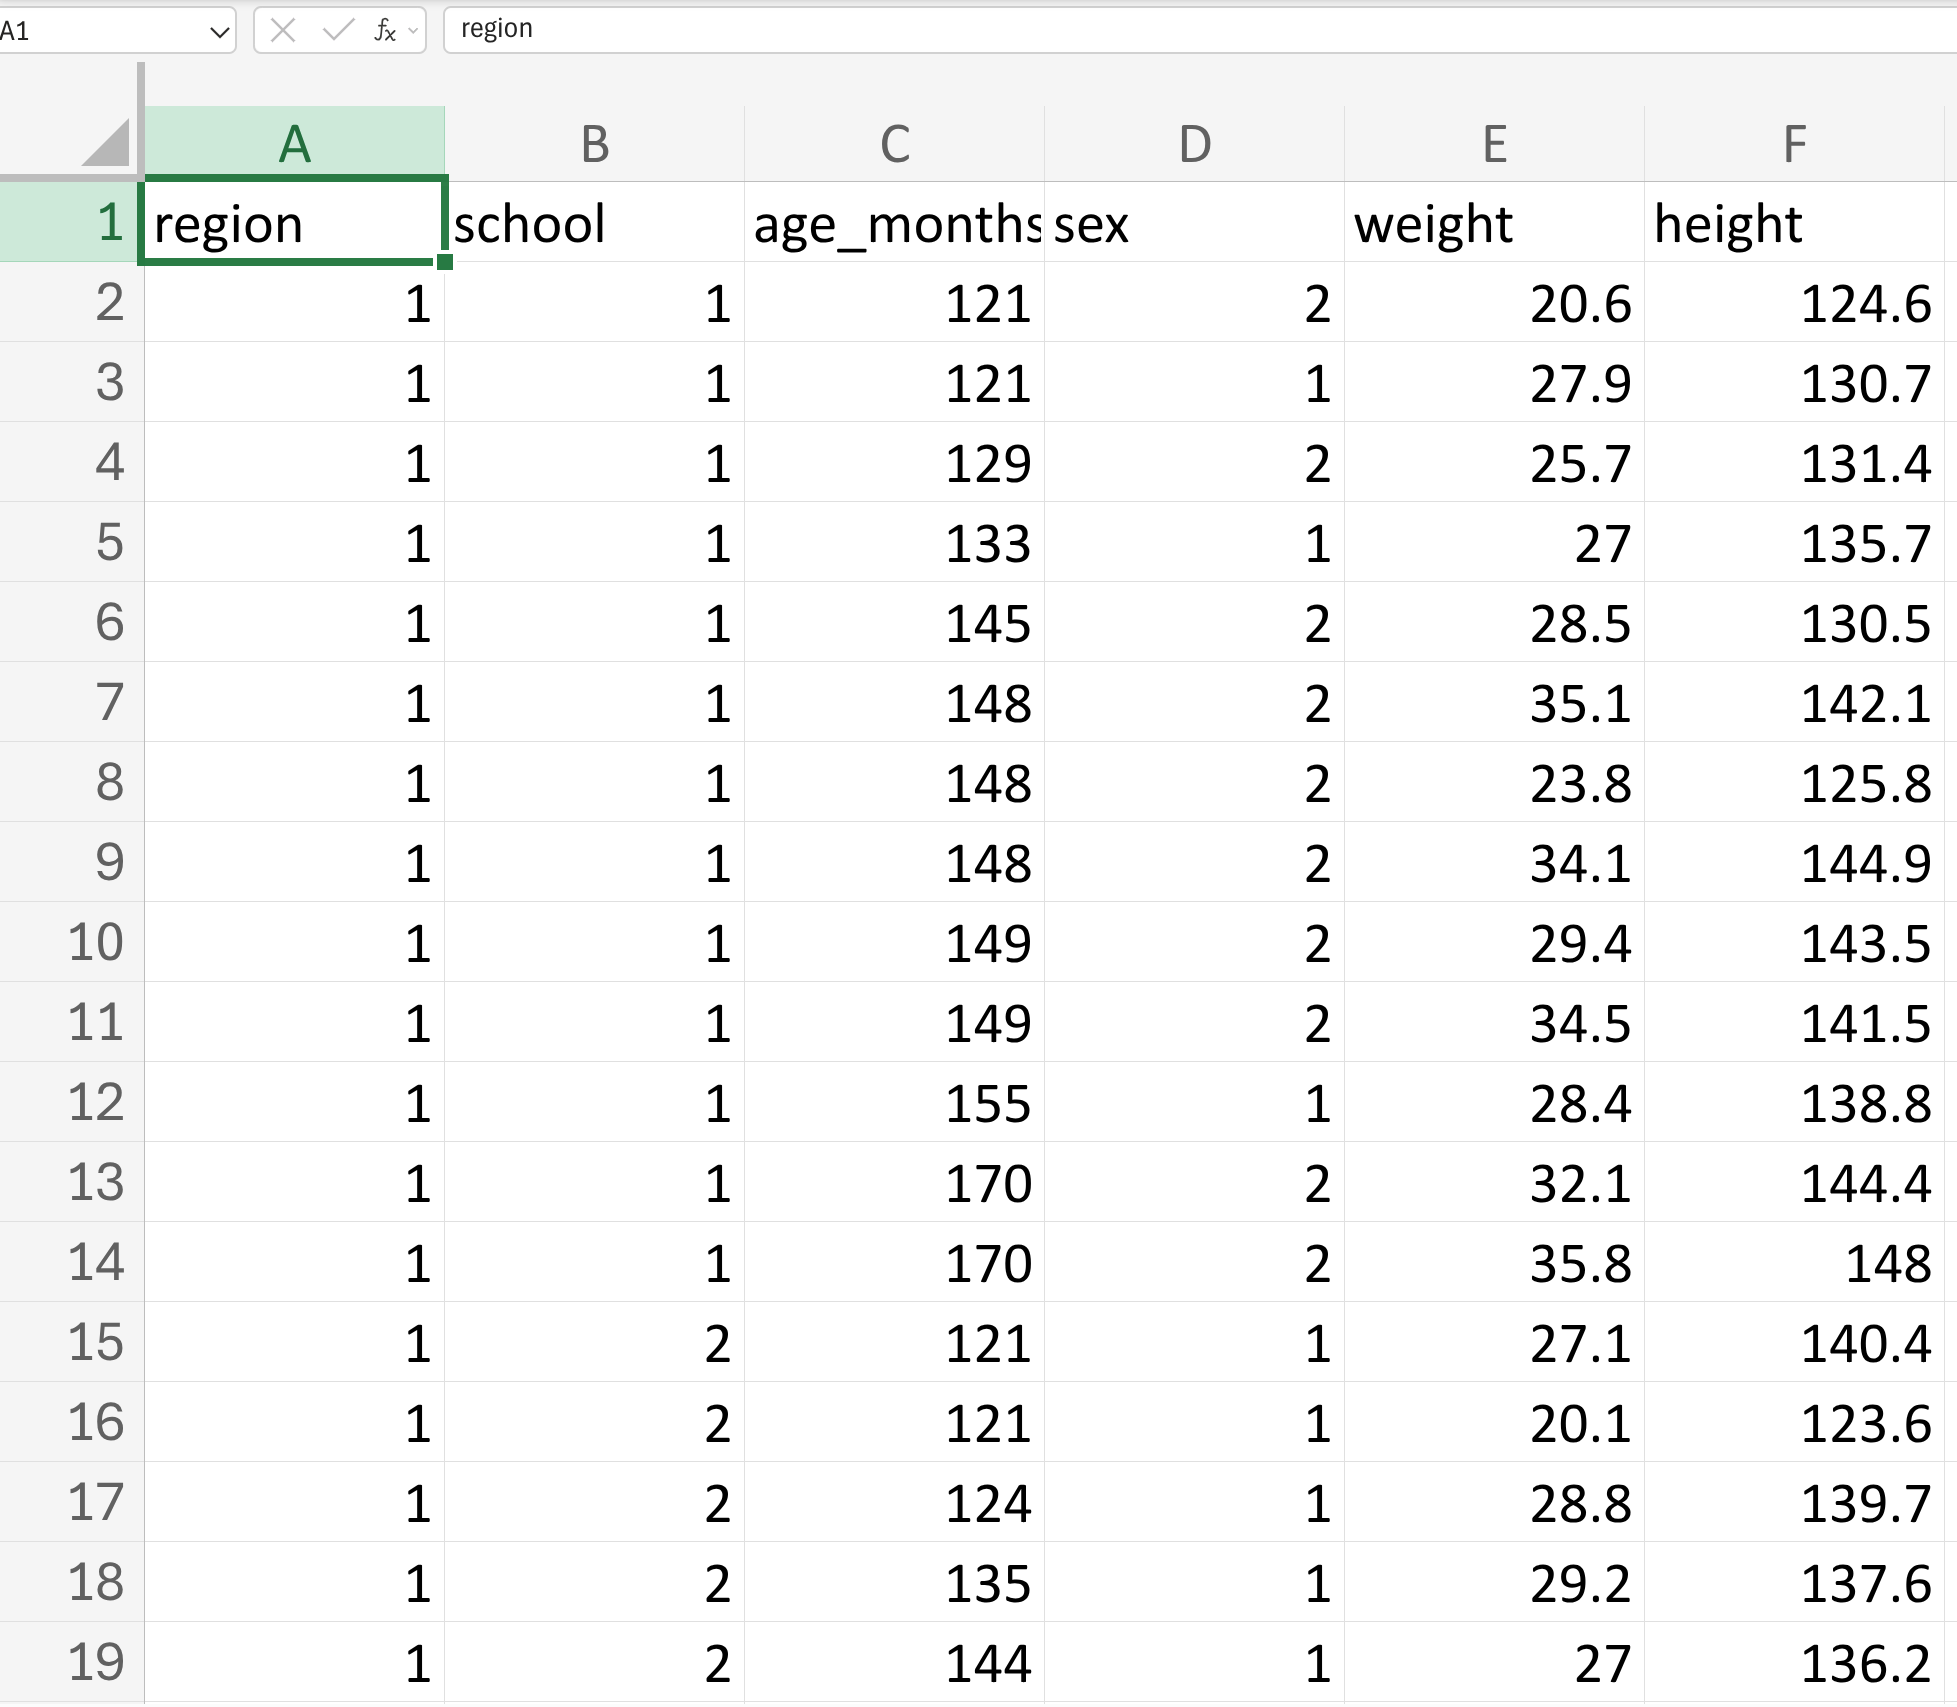
18.11 Use data validation to avoid errors
When handling data entry tasks using spreadsheets, it’s crucial to aim for accuracy and comfort to minimise errors and reduce physical strain. Excel provides a helpful Data Validation feature that can prevent errors during data entry.
To use this feature:
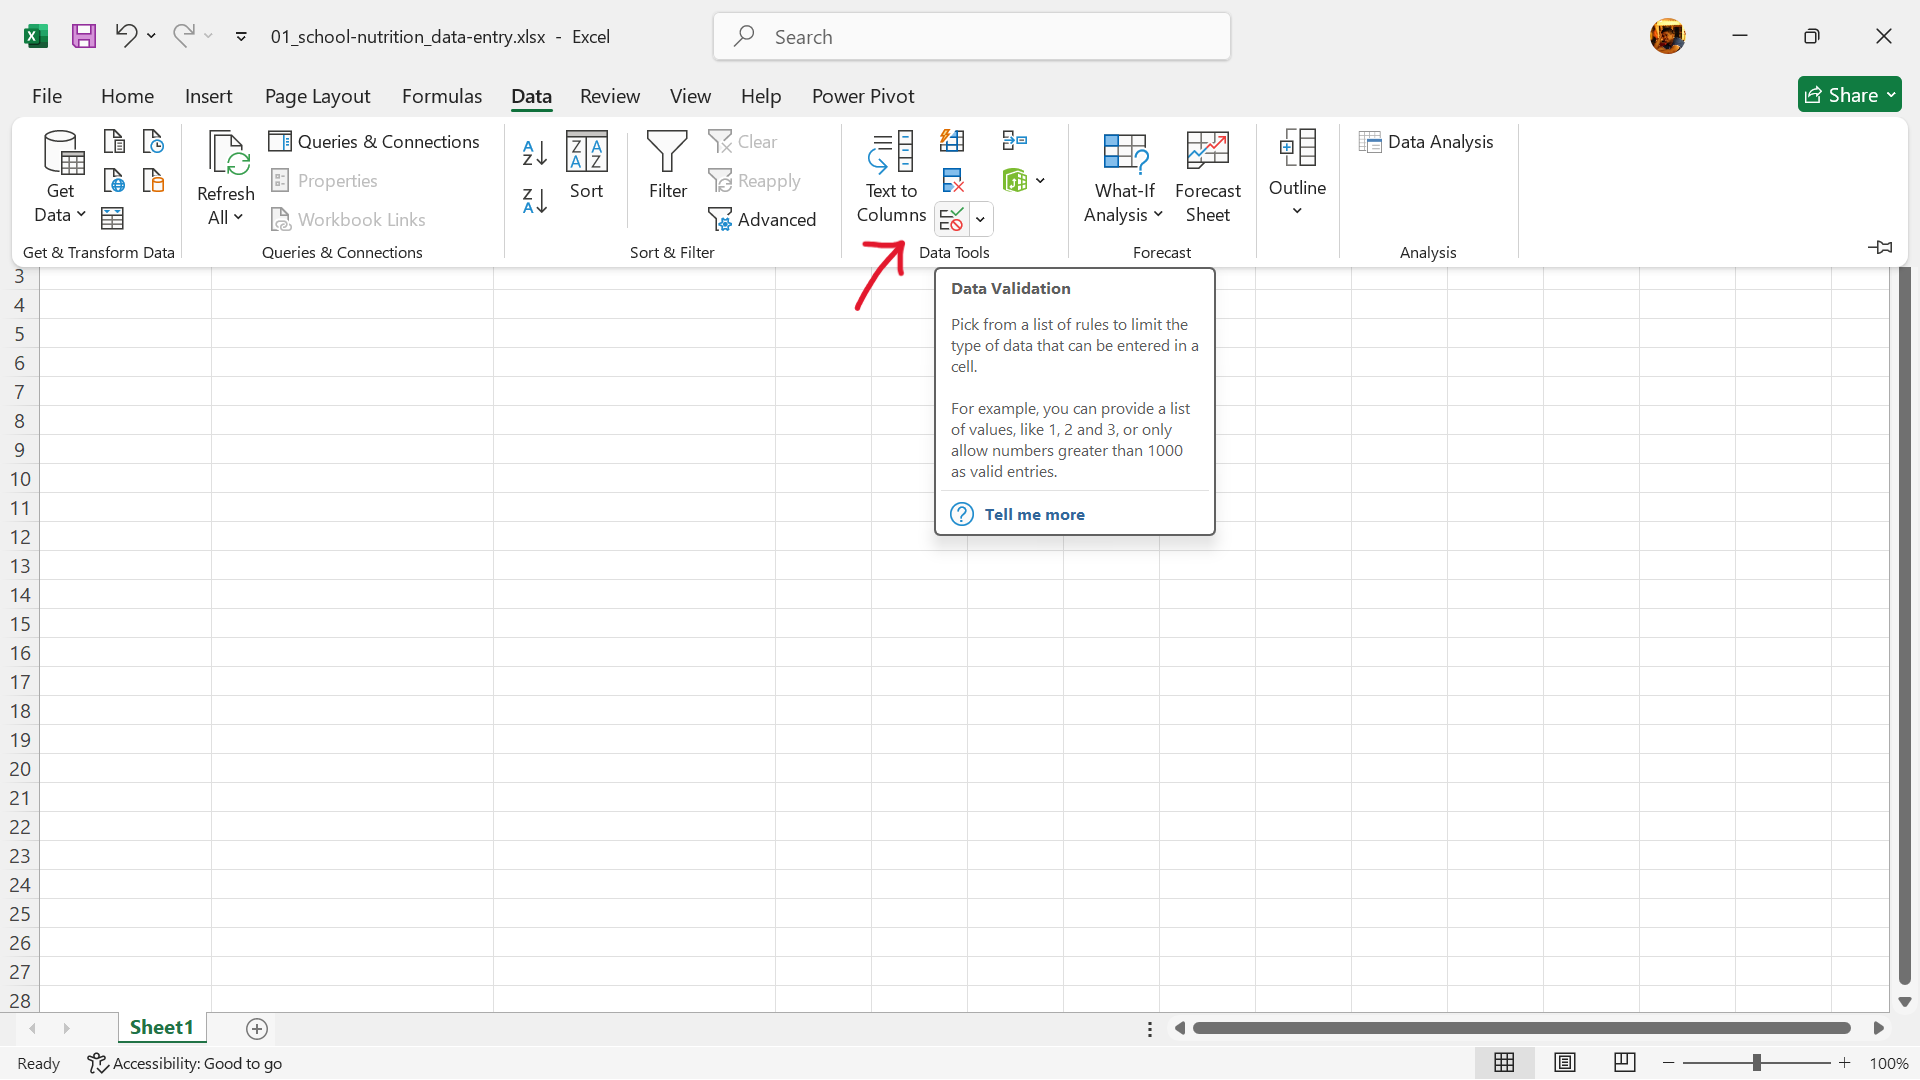
- Choose the column you wish to validate. In Figure 18.35, the data entry for the
agevariable is to be validated.
- Go to the menu bar and select
Data --> Data Tools --> Data Validationas shown in
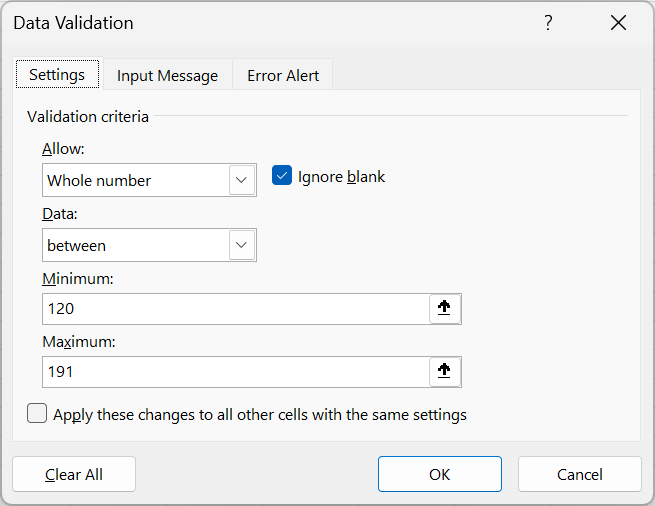
- Set up validation criteria such as:
- Whole numbers within a specified range
- Decimal numbers within a specified range
- A predefined list of acceptable values
- Text with length restrictions
In Figure 18.37, we set validation for age variable to allow only whole numbers ranging from 120 to 191 (inclusive). The Ignore blank option is ticked so that blank entry will be accepted.
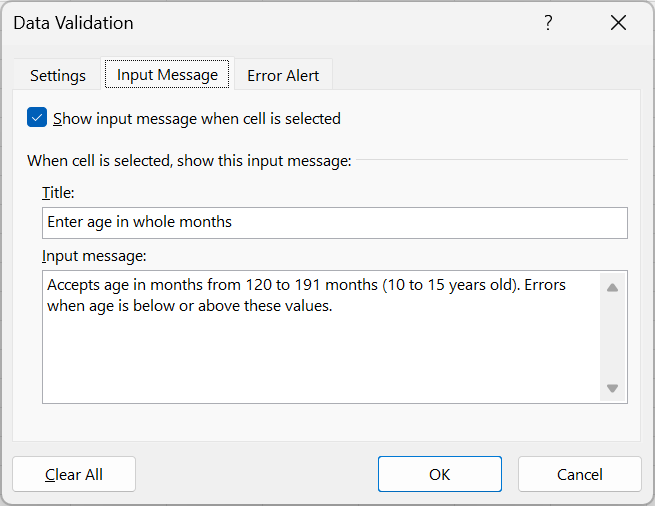
- Add title and message to guide data entry input as shown in Figure 18.38.
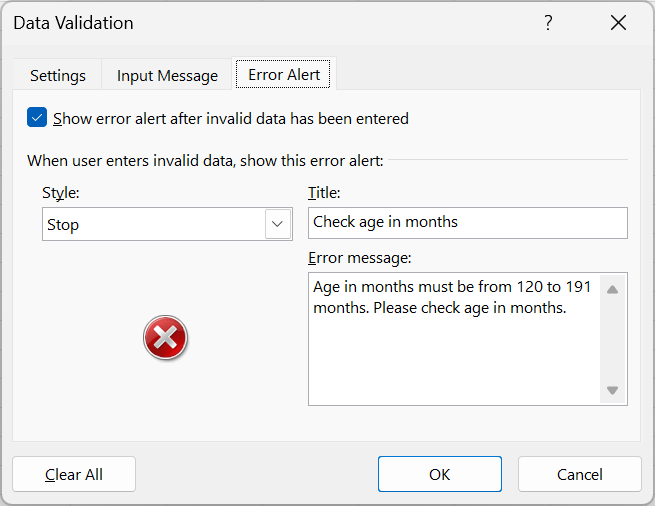
- Add error alert to show up when incorrect data entry input is made as shown in Figure 18.39
Microsoft Support has further documentation and guidance on how to apply data validation to cells here.
Additionally, formatting cells as “Text” can prevent unintended changes to data like dates or names. In Section 18.3, the steps to change formatting of cells is described and demonstrated.
While these steps may seem tedious, they are valuable in maintaining data integrity and minimising errors during entry.