15 Data tools
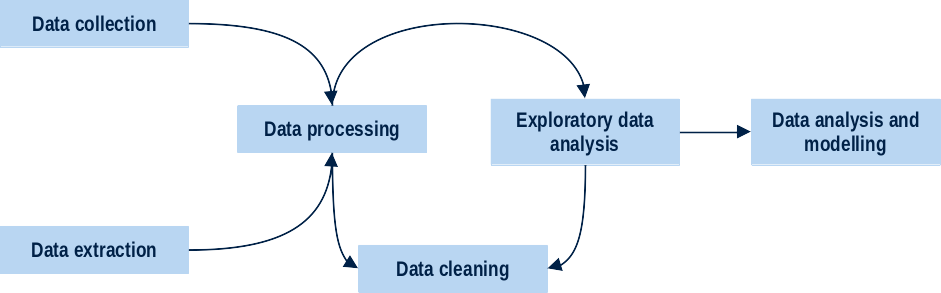
Working with data is a multi-faceted endeavour that involves collecting, storing, analysing, visualising, securing, and managing data across various domains. The various steps in the data pathway (see Figure 15.1) often require specific tools that are best-suited for the task at hand.
In this section, we present the most common data tools, describe their key functionalities, and discuss what each tool is best suited for in relation to the steps in the data pathway.
15.1 Microsoft Excel and other Excel-like spreadsheet software
Microsoft Excel is versatile spreadsheet software with robust formula capabilities, pivot tables for quick data summarisation, and Power Query for advanced data cleaning. Other than for data collection, it is also suited for detailed analysis, budgeting, and financial tracking. Suitable for complex data management. On the other hand, some may find that using it presents a steeper learning curve and costs of the subscription-based software-as-a-service (SaaS) model as part of Microsoft 365 can be prohibitive.
An estimated 750 million up to 1.5 billion people1 use Microsoft Excel. It has numerous applications, including data entry, analysis, accounting, financial modelling, and reporting. It’s used in various fields like business, education, and personal finance to organise, manage, and visualise data.
Other than Microsoft Excel, there are Excel-like applications available as part of a suite of office applications that use the Open Document Form (ODF), an open file format for word processing documents, spreadsheets, presentations and graphics and using ZIP-compressed XML files. It was developed with the aim of providing an open, XML-based file format specification for office applications. ODF was based on the Sun Microsystems specification for OpenOffice.org XML, the default format for OpenOffice.org and LibreOffice. This standard was originally developed to provide an open standard for office documents. Versions of Microsoft Excel since 2003 use the ODF XML standard to afford compatibility to other spreadsheets that use the standard. A number of free and proprietary software use the ODF XML standard hence there are various Excel-like spreadsheet alternatives available that use the standard2 and are mostly compatible with Microsoft Office/Microsoft 365 applications including Excel. Although generally compatible in almost all of the basic features, Excel-like spreadsheet applications may not fully implement highly customised Excel spreadsheets that use Visual Basic for Applications (VBA) macros as there are significant differences in syntax and implementation to LibreOffice Calc’s Basic macro system and environment.
15.2 Google Sheets
Google Sheets, a free and web-based spreadsheet application, is a versatile data tool used for organising, managing, and analysing data, as well as creating visualisations. It’s part of the Google Workspace suite, along with Google Docs and Google Slides. Sheets offers features like pivot tables, formulas, conditional formatting, and data validation for a variety of data-related tasks.
Google Sheets is technically not an Excel-like spreadsheet (although general use and behaviour is similar to Excel) as it doesn’t use the ODF XML standard but rather has its own proprietary format called the Google Sheets format which can only be accessed or utilised through a web browser rather than through a standalone installer for your computer. In order to access/open a Google Sheets format outside of a browser, one h as to download it as either an Excel file or as a comma-separated value (CSV) file which can then be opened in Excel. Google Sheets has similar features and functionalities as Excel but because of its indirect compatibility with Excel and Excel-like ODF XML-compliant software, advanced features of both applications are not interoperable.
15.3 Google Forms
Google Forms is a tool for creating online forms, surveys, and quizzes that can be shared with others to collect data. It allows users to create and edit these forms online, collaborate in real-time, and have the collected data automatically entered into a spreadsheet. Google Forms is part of the free, web-based Google Suite and the software-as-a-service (SaaS) Google Workspace which includes Google Docs, Google Sheets, Google Slides, Google Drawings, Google Sites, and Google Keep. Google Forms is only available as a web application.
15.4 Airtable
Airable is a spreadsheet-database hybrid, with the features of a database but applied to a spreadsheet. The fields in an Airtable table are similar to cells in a spreadsheet, but have types such as ‘checkbox’, ‘phone number’, and ‘drop-down list’, and can reference file attachments like images.
Users can create a database, set up column types, add records, link tables to one another, collaborate, sort records and publish views to external websites. Users cannot download their database in full, but can download some of the data by manually downloading CSVs for each table.
Airtable is user-friendly and is designed for ease of use, making it accessible to a wide range of users, including those without technical backgrounds. It also enables users to build and customise applications for various purposes, such as managing product roadmaps, launching marketing campaigns, and tracking job applications. It facilitates collaboration by allowing multiple users to access and work on the same database. Airtable integrates with various other platforms, enabling data to be shared and workflows to be automated.
15.5 QuickBooks and other accounting-specific software
QuickBooks is a popular accounting software designed to help businesses manage their finances, including tasks like bookkeeping, invoicing, expense tracking, and payroll.
QuickBooks is a widely used accounting software known for its ease of use and automation capabilities. It’s a solution for small to medium-sized businesses (SMEs), offering features like invoicing, expense tracking, inventory management, and payroll processing.
15.5.1 Other Accounting Software
Beyond QuickBooks, several other software options exist, each with its strengths and weaknesses:
Xero: Offers a user-friendly interface and strong integration capabilities, making it popular among small businesses.
Sage 50: A desktop accounting software with robust reporting and features for larger businesses.
Wave Accounting: A free option that provides basic accounting features, suitable for startups and small businesses.
Zoho Books: A comprehensive online accounting software with various features, including project management.
FreshBooks: A popular choice for freelancers and sole proprietors, known for its simplicity.
15.5.2 Key Features of Accounting Software
Common features across different accounting software include bookkeeping and recording of financial transactions, invoicing, expense tracking and managing and categorising business expenses, payroll processing financial reporting to generate reports like income statements and balance sheets, and inventory management to track and manage inventory levels.
15.6 Business intelligence and analytics platforms
Power BI, Tableau, and Qlik are classified as business intelligence (BI) tools or data analytics platforms. They share the common goal of enabling users to interact with data, visualise it, analyse it, and ultimately, make data-driven decisions. However, they each have unique strengths and features that cater to different needs and preferences.
15.6.1 PowerBI
Microsoft’s BI platform offers a wide range of functionalities, including data connectivity, data modelling, interactive visualisations, and dashboard creation. It’s known for its ease of use and seamless integration with other Microsoft products.
15.6.2 Qlik
This platform focuses on its associative data model, allowing users to explore relationships within data freely. It also offers strong data integration capabilities and is well-suited for large, complex datasets.
15.6.3 Tableau
Tableau is highly regarded for its visual analytics capabilities, enabling users to create stunning and interactive dashboards. It’s known for its user-friendly interface and strong visualisation options.
15.6.4 Comparison
15.6.4.1 Ease of Use
Power BI is generally considered to have a more intuitive interface, while Qlik Sense is more powerful but can have a steeper learning curve. Tableau’s drag-and-drop interface is known for its ease of use.
15.6.4.2 Data Integration:
Qlik is particularly strong in data integration and can handle diverse data sources, while Tableau offers a dedicated tool (Tableau Prep) for data preparation. Power BI’s data integration capabilities are also robust, particularly when used in conjunction with other Microsoft products.
15.6.4.3 Visualisation
Tableau is renowned for its visual analytics, offering a wide array of visual options and a focus on storytelling through data. Power BI also offers extensive visualisation capabilities, and Qlik provides a unique approach with its associative model.
15.6.4.4 Scalability and performance
All three tools are scalable, but Qlik is particularly well-suited for large, real-time datasets. Power BI is strong for smaller to medium datasets and can leverage Microsoft Azure for scalability. Tableau’s performance depends on the complexity of the dashboards, but it’s generally robust for complex visualisations.
15.6.4.5 Pricing
Power BI is known for its affordable pricing, while Tableau and Qlik Sense can be more expensive, particularly for enterprise users.
15.7 Cloud-based data storage
In today’s digital age, efficient data storage and quick access are crucial, particularly as remote work becomes more prevalent. Cloud storage solutions like Google Drive, Dropbox, and OneDrive have become vital tools for both businesses and individuals due to their ease of use and collaborative features.
15.7.1 Google Drive
Google Drive is a cloud storage service included in the Google Suite or Google Workspace of tools that allows users to store, sync, and access files across multiple devices and platforms via an internet connection. It also offers features like collaboration tools, document creation, and sharing capabilities.
15.7.2 OneDrive
OneDrive is a cloud storage service by Microsoft included in the Microsoft 365 set of applications that provides collaboration, document creation, and sharing tools. It allows users to store and sync files across multiple devices and offers 5GB of free storage. Paid plans are available for additional storage ranging from 50GB to 1TB.
15.7.3 Dropbox
Dropbox is a cloud storage service that allows users to store, share, and sync files across multiple devices. Available on Windows, Mac, iOS, and Android, it offers document creation, collaboration, and sharing tools. With 2GB of free storage, paid plans range from 200GB to 3TB for additional needs.
15.8 Databases
A database is an organised collection of structured and/or unstructured data, typically stored electronically in a computer system. It’s a system for storing and managing data, and it’s managed by a Database Management System (DBMS). Databases are used to store, retrieve, and manipulate data efficiently.
Hence, the concept of a database is both software, which deals with the handling and management of the data, and hardware, which deals with the physical storage of the data.
15.8.1 SQL and other relational databases
SQL databases, also known as relational databases, are systems that store collections of tables and organise structured sets of data in a tabular columns-and-rows format, similar to that of a spreadsheet. The databases are built using structured query language (SQL), the query language that not only makes up all relational databases and relational database management systems (RDBMS), but also enables them to “talk to each other”.
The history of database technology/relational databases SQL was invented as a language in the early 1970s, which means SQL databases have been around for as long as the Internet itself. Dubbed the structured English query language (SEQUEL), SQL was originally created to streamline access to relational database systems and to assist with the processing of information. Today, SQL remains one of the most popular and widely used query languages in open-source database technology due to its flexibility, ease of use, and seamless integration with a variety of different programming languages. You’ll find SQL being used throughout all types of high-performing, data-centric applications.
15.8.2 NoSQL
NoSQL stands for “Not Only SQL.” It refers to a type of database that doesn’t rely on the traditional relational database models, which are organised into tables with fixed schemas and use SQL for querying. NoSQL databases offer a more flexible approach to data storage and querying, often using document, graph, key-value, or other data models. NoSQL databases are equipped to handle large volumes of structured, semi-structured, and unstructured data from non-traditional sources.
Popular database management systems include Microsoft SQL Server, PostgreSQL, MongoDB, Redis, Elasticsearch, SQLite, MariaDB, IBM Db2, Oracle Database, and MySQL. In essence, databases are fundamental to modern IT infrastructure, enabling organisations to store, manage, and analyse data efficiently for various applications, including websites, apps, and business processes.
15.9 Management information systems
A Management Information System (MIS) is an integrated system that collects, processes, stores, and disseminates information to support managerial decision-making and improve operational efficiency. It essentially acts as a tool for gathering and analysing data, converting it into actionable insights, and making those insights available to the right people within an organisation.
15.9.1 Key Features
Data Collection and Storage - MIS systems gather data from various sources, both internal (e.g., sales records, inventory) and external (e.g., market trends, competitor information).
Data Processing and Analysis - The collected data is processed and analysed to identify trends, patterns, and opportunities, often using sophisticated tools and techniques.
Information Dissemination - The analysed information is then formatted and delivered to managers and other stakeholders in a way that is easy to understand and use.
Decision Support - MIS provides the information that managers need to make informed decisions about various aspects of their business, such as sales, marketing, finance, and operations.
Improved Efficiency - By providing timely and accurate information, MIS helps organisations to operate more efficiently, reduce costs, and improve decision-making.
15.9.2 Examples of MIS applications
Sales and Marketing - Tracking sales figures, analysing marketing campaign effectiveness, and identifying customer trends.
Accounting and Finance - Managing financial records, generating financial statements, and tracking investments.
Human Resources - Managing employee information, tracking performance, and supporting recruitment and training activities.
Inventory Management - Tracking inventory levels, managing warehouses, and forecasting demand.
Health records - tracking of patients and clients of various health services. This is often called a Health Management Information System (HMIS).
Customer-relationship manager - tracking of clients/customers data and interactions with company (see Section 15.10).
15.10 Customer-relationship Manager
Customer Relationship Management (CRM) systems are software applications that help businesses manage and analyse customer data and interactions. They are used to collect, organise, and process information about customers, including their interactions, preferences, and purchase history. The goal is to improve customer service, increase customer retention, and drive sales growth.
15.10.1 Key Features and Functionality
15.10.2 Data Management
CRMs store and organise customer data from various sources, like sales interactions, customer service inquiries, marketing campaigns, and social media.
15.10.2.1 Sales Management
CRMs help track sales opportunities, pipeline management, and sales activities, enabling sales teams to improve efficiency and close deals faster.
15.10.2.2 Customer Service
CRMs facilitate communication with customers, track service requests, and help resolve issues, leading to improved customer satisfaction.
15.10.2.3 Marketing Automation
CRMs can be integrated with marketing automation tools, allowing businesses to personalise and automate marketing campaigns.
15.10.2.4 Reporting and Analytics
CRMs provide insights into customer behaviour, sales performance, and overall business trends, enabling data-driven decision-making.
15.10.3 Types of CRM Systems
Operational CRM - Focuses on day-to-day customer interactions, such as sales and customer service.
Analytical CRM - Analyses customer data to identify trends, patterns, and opportunities.
Collaborative CRM - Facilitates communication and collaboration between different departments, such as sales, marketing, and customer service.
Strategic CRM - Uses customer insights to make strategic decisions about product development, pricing, and market positioning.
15.10.4 Benefits of using a CRM
Improved Customer Service - By having a centralised database of customer information, companies can provide better and more personalised service.
Increased Sales - CRMs help sales teams manage leads, track opportunities, and close deals more effectively.
Enhanced Customer Retention - By understanding customer preferences and needs, businesses can build stronger relationships and retain customers.
Data-Driven Decision Making - CRMs provide valuable insights into customer behaviour and business performance, enabling data-driven decision-making.
Increased Efficiency - Automating tasks and streamlining processes can free up employees to focus on more strategic initiatives.
15.11 Statistical packages
SAS, SPSS, and Stata are popular statistical software packages used for data analysis, but have distinct strengths and target industries. SPSS is known for its user-friendly interface, making it popular in social sciences and market research. Stata is a general-purpose statistical software, often favoured for econometrics, and known for its command-line interface and strong data management features. SAS is a powerful system for advanced analytics, business intelligence, and data management, and is widely used in various industries due to its scalability and robustness.
15.11.1 SPSS
Statistical Package for the Social Sciences or SPSS has a ser-friendly interface and intuitive data management making it suitable for social sciences and market research. It focuses on descriptive and inferential statistics, data exploration, and model building. Its common uses are for surveys, market research, data mining, and other social science applications. The interface is Menu-driven with a graphical user interface.
15.11.2 Stata
Stata is a general-purpose software with strong data management capabilities, and a command-line interface. It is used commonly in econometrics, time series analysis, and statistical modelling. Its most common uses are in economics, biomedicine, and political science research. It has some graphical user interface but full capability is accessed via the command-line. It has a graphical output.
15.11.3 SAS
SAS or Statistical Analysis System is robust, scalable, and suitable for advanced analytics, business intelligence, and data management. It can be used for Multivariate analysis, predictive analytics, and large-scale data processing. It’s common uses are for business analytics, data warehousing, and industry-specific applications. The interface to SAS is primarily as a procedural language.
15.12 Programming languages
R, Python, and Julia are powerful programming languages frequently used in data science, scientific computing, and related fields. They offer distinct advantages, making them suitable for various tasks.
15.12.1 R
R is a language and environment for statistical computing and graphics. It is a GNU project which is similar to the S language and environment which was developed at Bell Laboratories (formerly AT&T, now Lucent Technologies) by John Chambers and colleagues. R can be considered as a different implementation of S. There are some important differences, but much code written for S runs unaltered under R.
R provides a wide variety of statistical (linear and non-linear modelling, classical statistical tests, time-series analysis, classification, clustering, etc.) and graphical techniques, and is highly extensible. The S language is often the vehicle of choice for research in statistical methodology, and R provides an Open Source route to participation in that activity.
One of R’s strengths is the ease with which well-designed publication-quality plots can be produced, including mathematical symbols and formulae where needed. Great care has been taken over the defaults for the minor design choices in graphics, but the user retains full control.
R is available as Free Software under the terms of the Free Software Foundation’s GNU General Public License in source code form. It compiles and runs on a wide variety of UNIX platforms and similar systems (including FreeBSD and Linux), Windows and MacOS.
R is unique in that it is not general-purpose. It does not compromise by trying to do a lot of things. It does a few things very well, mainly statistical analysis and data visualisation. While you can find data analysis and machine learning libraries for languages like Python, R has many statistical functionalities built into its core. No third-party libraries are needed for much of the core data analysis you can do with the language.
But even with this specific use case, it is used in every industry you can think of because a modern business runs on data. Using past data, data scientists and data analysts can determine the health of a business and give business leaders actionable insights into the future of their company.
Just because R is specifically used for statistical analysis and data visualisation doesn’t mean its use is limited. It’s actually quite popular, ranking 12th in the TIOBE index of the most popular programming languages.
Academics, scientists, and researchers use R to analyse the results of experiments. In addition, businesses of all sizes and in every industry use it to extract insights from the increasing amount of daily data they generate.
15.12.2 Python
Python is an interpreted, interactive, object-oriented programming language. It incorporates modules, exceptions, dynamic typing, very high level dynamic data types, and classes. It supports multiple programming paradigms beyond object-oriented programming, such as procedural and functional programming. Python combines remarkable power with very clear syntax. It has interfaces to many system calls and libraries, as well as to various window systems, and is extensible in C or C++. It is also usable as an extension language for applications that need a programmable interface. Finally, Python is portable: it runs on many Unix variants including Linux and macOS, and on Windows.
Python is a high-level general-purpose programming language that can be applied to many different classes of problems.
The language comes with a large standard library that covers areas such as string processing (regular expressions, Unicode, calculating differences between files), internet protocols (HTTP, FTP, SMTP, XML-RPC, POP, IMAP), software engineering (unit testing, logging, profiling, parsing Python code), and operating system interfaces (system calls, filesystems, TCP/IP sockets). Look at the table of contents for The Python Standard Library to get an idea of what’s available. A wide variety of third-party extensions are also available. Consult the Python Package Index to find packages of interest to you.
15.12.3 Julia
Julia is a high-level, open-source, general-purpose programming language designed for technical and scientific computing. It’s known for its fast performance, approaching that of languages like C and Fortran, while remaining relatively easy to use. Julia is particularly well-suited for tasks like numerical analysis, data science, and machine learning.
It is challenging to make more precise estimates for this. The lower end of this estimate is most likely very conservative and based on historical information. The upper end of this estimate is based on Microsoft’s own estimation based on subscription to Microsoft 365. These estimates likely don’t include unlicensed or unauthorised usage of the software.↩︎
To see a list of free and proprietary software that use the ODF XML standard, see https://en.wikipedia.org/wiki/OpenDocument.↩︎